Intent Dashboard
Intent Dashboard allows users to create a dashboard to display the intent results through the wizard without creating reports first, and users can save those frequently used dashboards as templates to reuse them. Intent Dashboard can be created directly from Intent column of an ADT/a map/an Intent (Map, Path, or common Intent). The major use cases of Intent Dashboard are:
- Troubleshoot Transient Problems
- Impact Analysis
- Preventive Automation
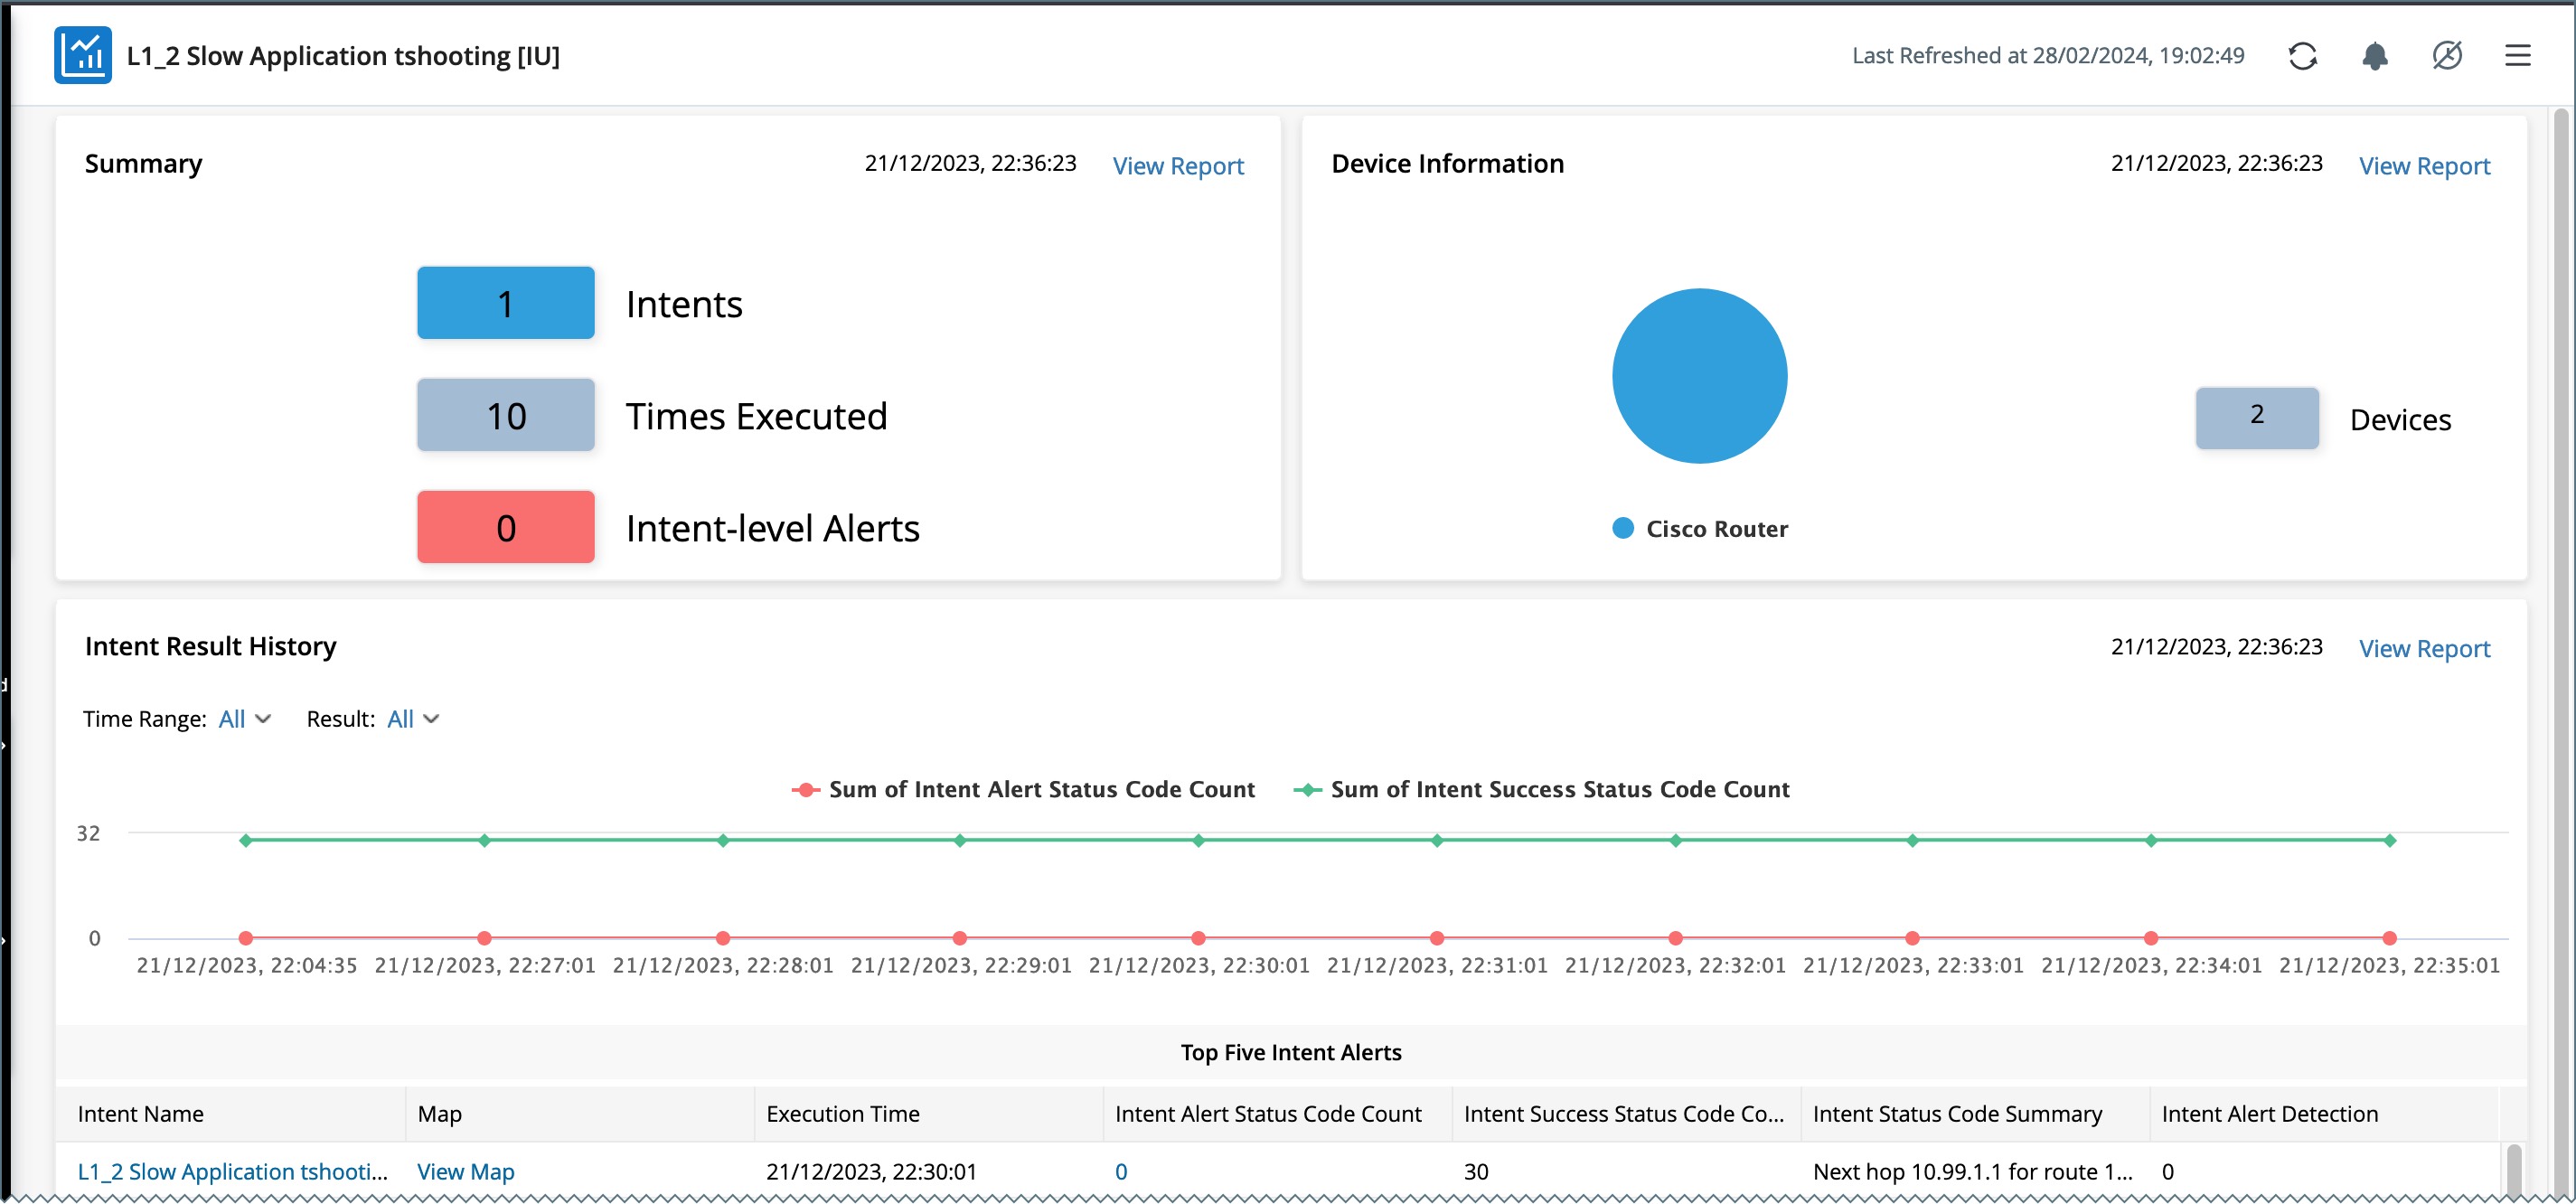
Example: There is a slow application issue in network. Create an Intent to troubleshoot this transient problem, then execute it every 15 minutes for one week. The Intent Dashboard is created to display the results of each execution to and help navigate the time when the problem is found. The Intent Dashboard will be auto-refreshed to update the execution result of the intent and provide an alert notification by email.
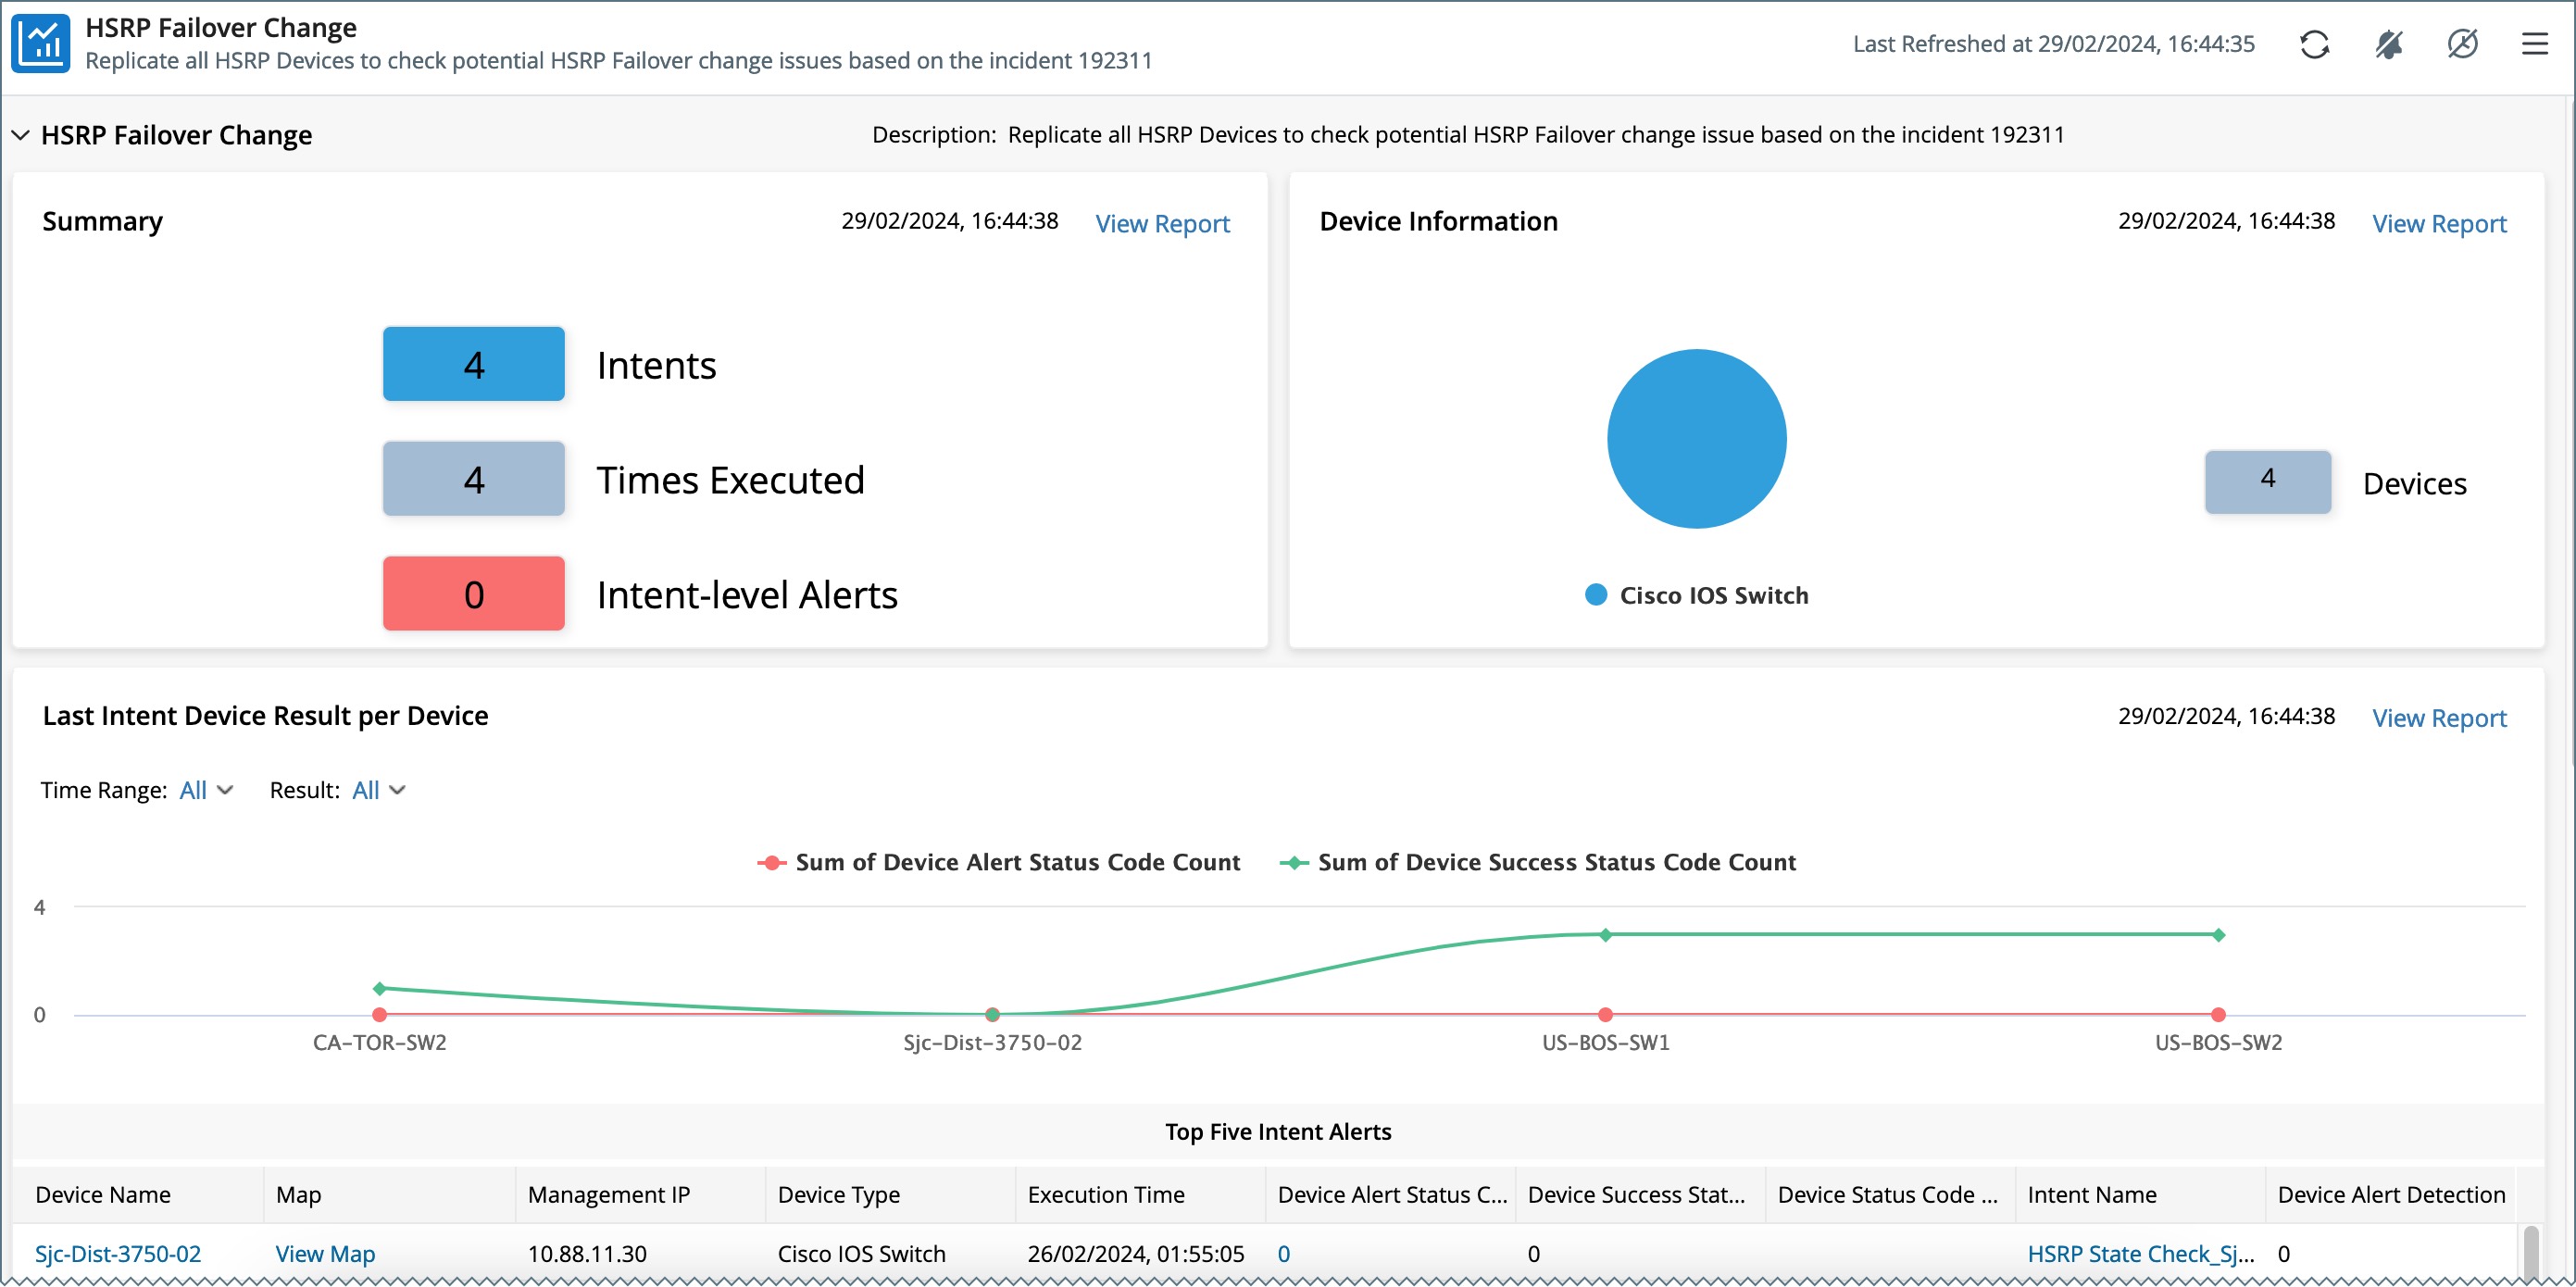
Create a Dashboard from a Map to include the devices as the Intent devices to analyze the impact on relevant critical assets, such as failover links and critical applications.
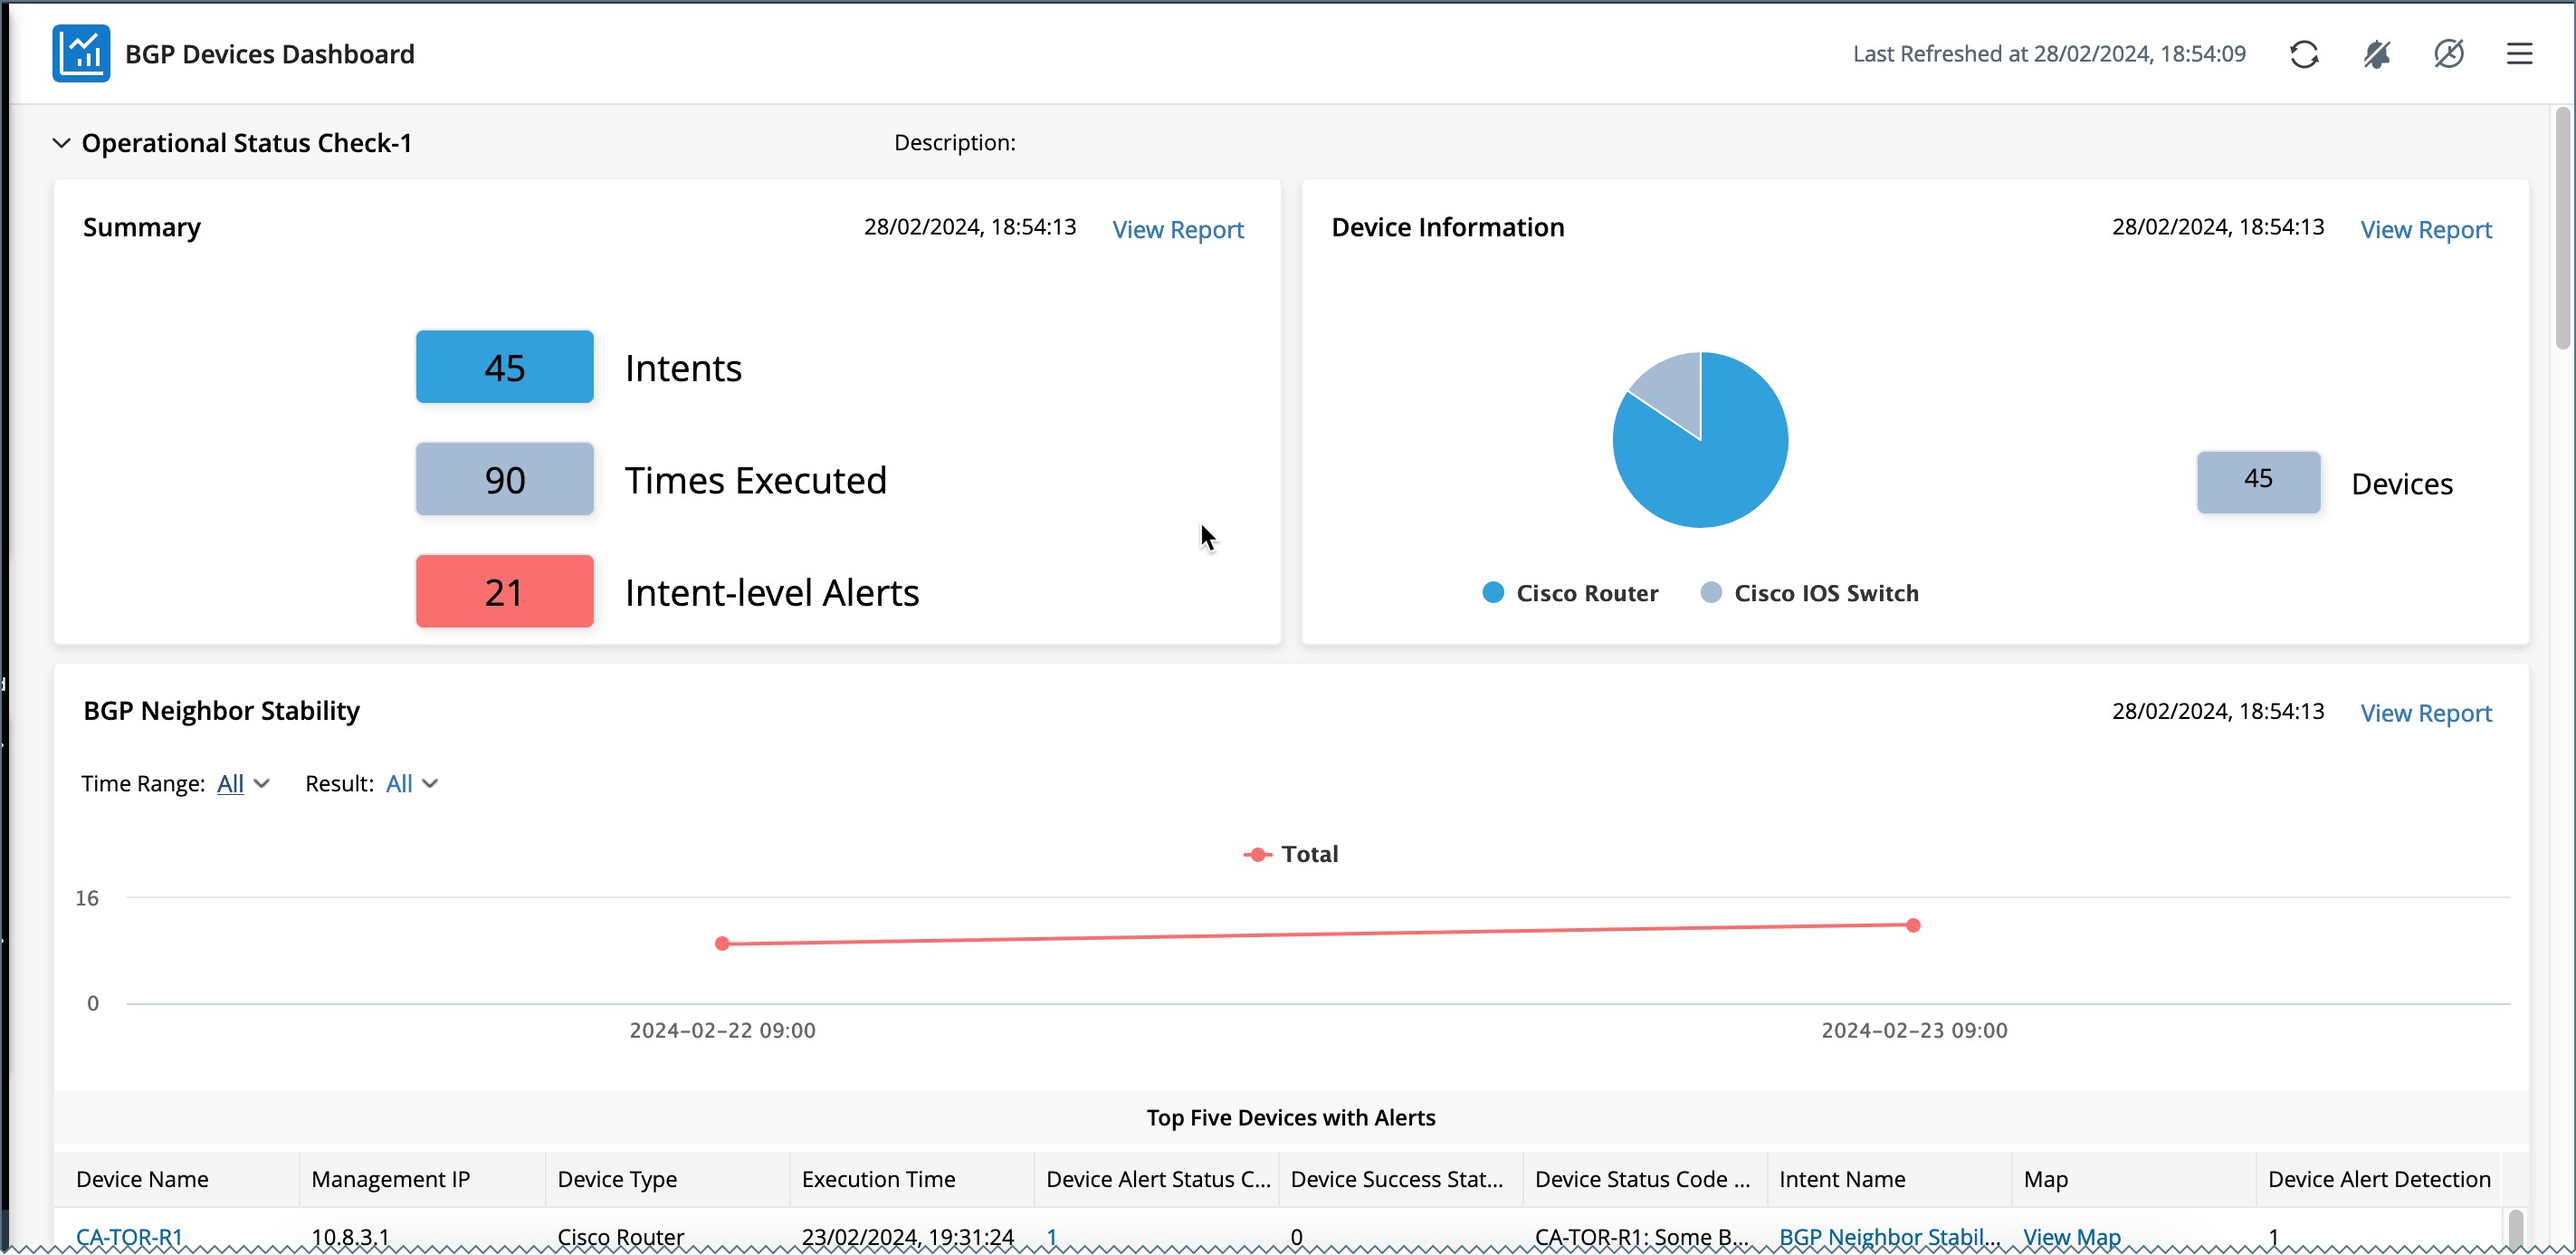
Create an Intent Dashboard for Preventive Automation, such as monitoring failover links and configuration drifts.
Key Components
Intent Dashboard has the following key components:
- Summary: An Intent Summary chart will display their names, times executed and intent alerts.
- Device information: The device information will display the properties of intent devices, such as name, vendor/model, management IP, device intent status code, etc.
- Intent results History: The intent result chart will display the historical or last intent results, the intent or device intent results. The data can be the success count or alert status count, or both. The time grain can be real-time, hourly, daily, weekly, or monthly.
- Refresh Dashboard: The Dashboard can be auto or manually refreshed.
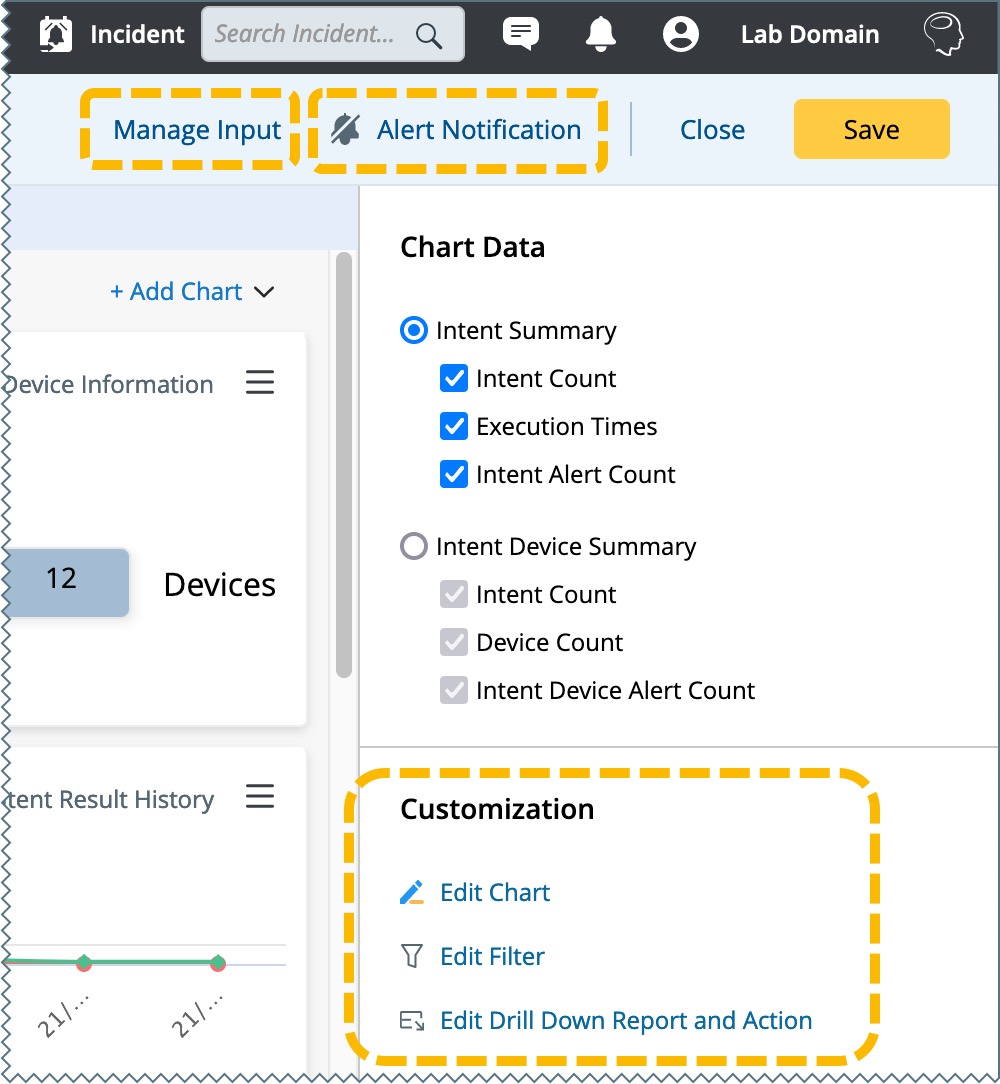
- Manage Input: One Intent Dashboard can have multiple intent groups as input sources. Each Intent group defines the results of some intents as input sources for dashboard.
- Edit Chart: Each chart can have its customized style and callout, like the standard Dashboard.
- Edit Filter: Each chart can have its filter, either by time range or by results (with or without alert).
- Edit Drill Down Report and Action: Each chart element can have its drill-down report and action.
-
Alert notifications: Users can select whether to send alert notifications by email, which can be useful for troubleshooting transient problems and PAF.