R12.1 JA-2025July15

Edit Chart

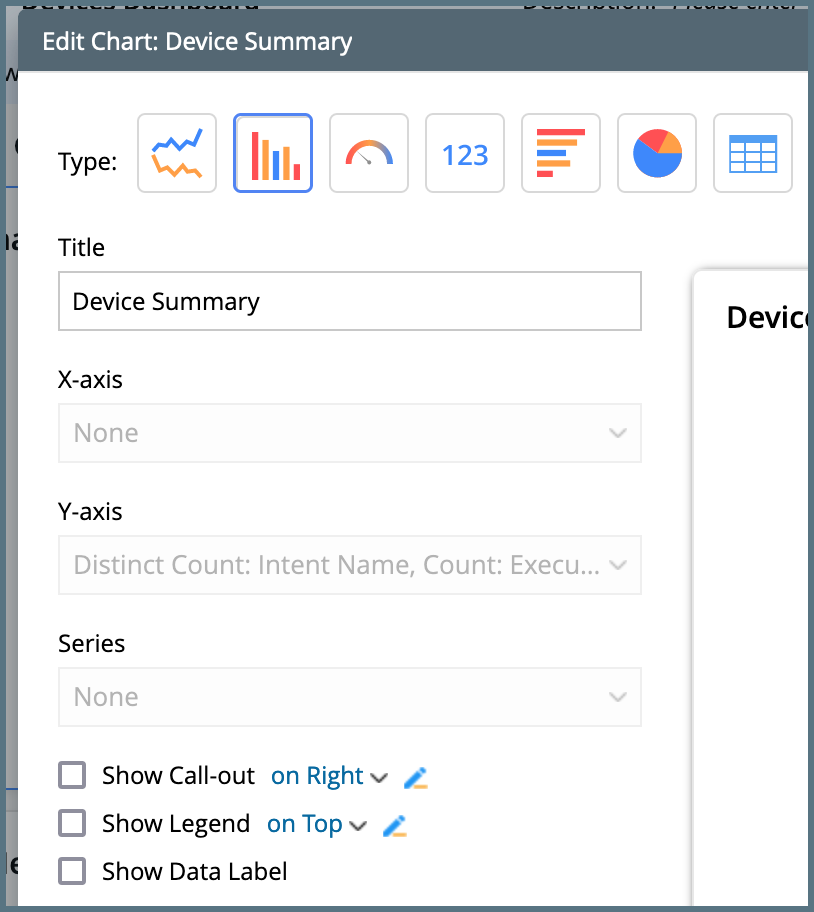
To modify the display settings of the selected chart, click Edit Chart located in the right-side pane. In the Edit Chart interface, you can modify the chart type, title, call-out, and other settings. After adjusting the settings, click OK to save and close the window.

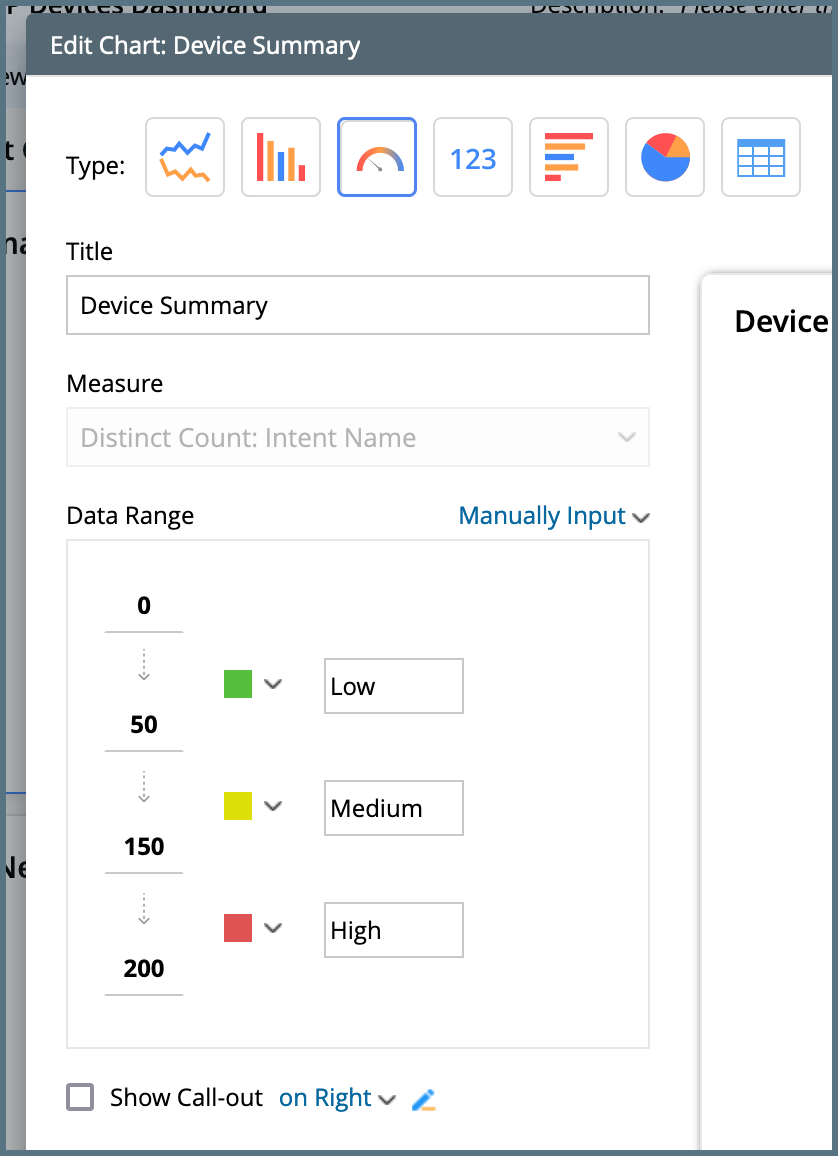
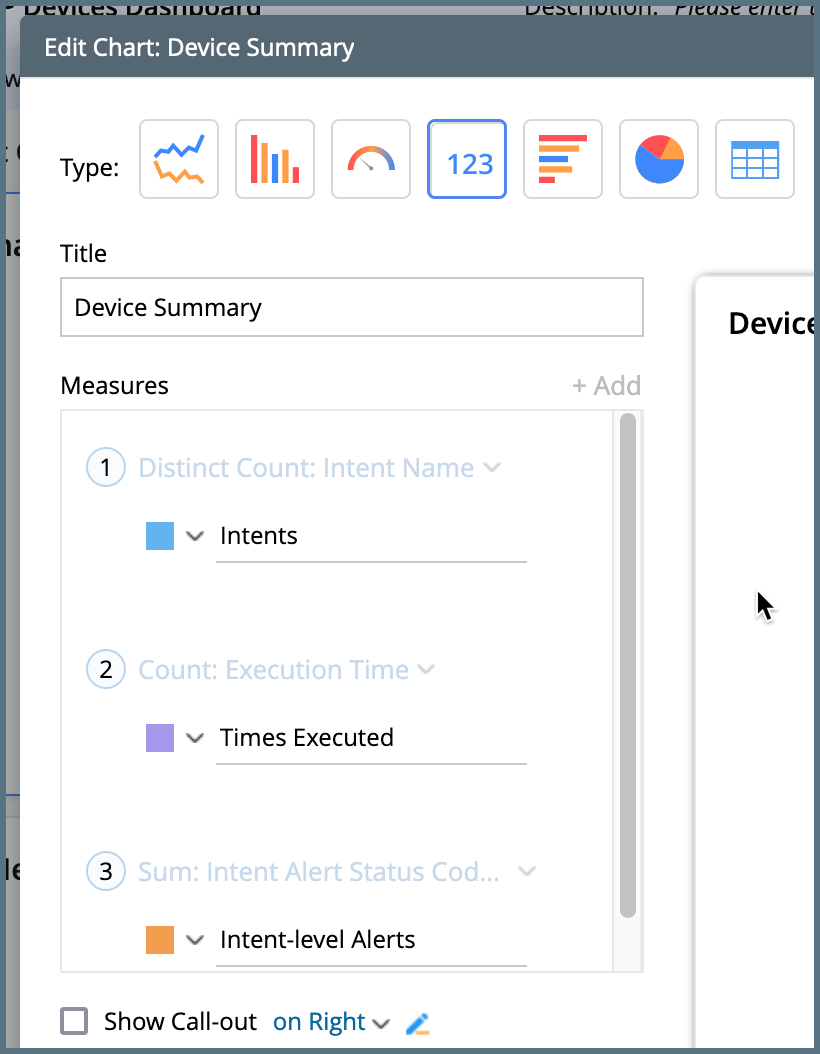
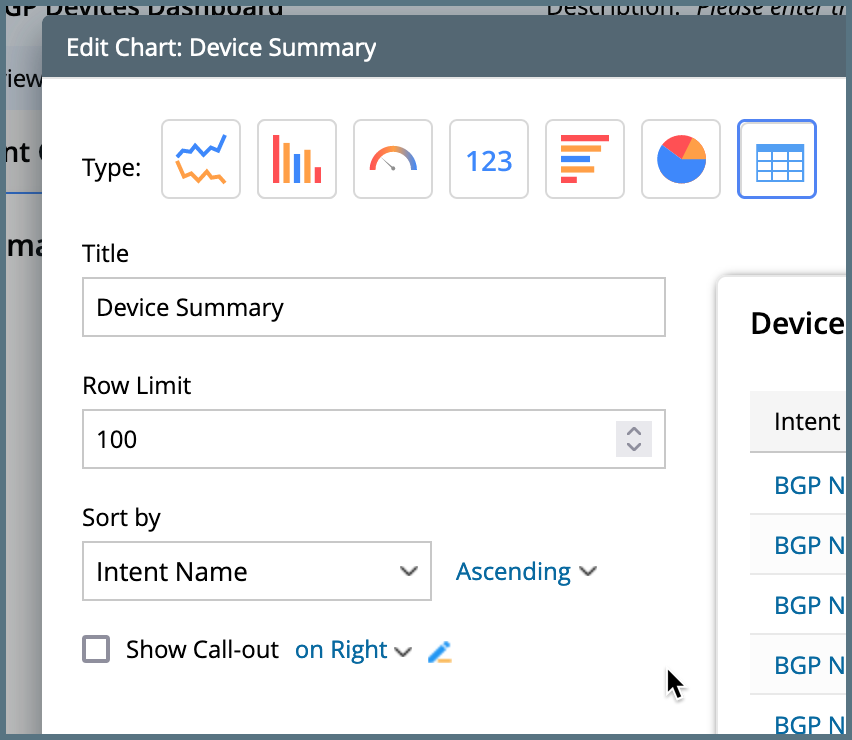
In Edit Chart dialogue, users can modify the chart settings such as chart type, chart title, call-out, etc. It also displays the chart data settings such as the x-axis, y-axis, etc. The table below illustrates the data displayed and defined in Edit Chart Dialogue. The chart setting is like the standard Dashboard

Chart Type UI Annotation for Chart Settings Chart Settings Data Displayed

Line Chart, Bar Chart, Column Chart


  • Chart Title: It is generated by default according to Chart Data settings. Users can customize it according to their needs.
  • Call-out: Check Show Call-out to display call-out on the chart. Users can display the call-out on the right or bottom of the chart.
  • Legend: Check Show Legend to display the data legends on the chart. Users can display the legend on the chart's top, right, or bottom.
  • Data Label: Check Show Data Label to display the data details on the chart.
  • X-axis
  • Y-axis
  • Series

  • Gauge Chart
    • Chart Title: It is generated by default according to Chart Data settings. Users can customize it according to their needs.
    • Data Range
    • Label
    • Label Color
    • Call-out: Check Show Call-out to display call-out on the chart. Users can display the call-out on the right or bottom of the chart.


  • Measure
  • Metric Chart
    • Chart Title: It is generated by default according to Chart Data settings. Users can customize it according to their needs.
    • Label
    • Label Color
    • Call-out: Check Show Call-out to display call-out on the chart. Users can display the call-out on the right or bottom of the chart.


  • Measure
  • Pie Chart
    • Chart Title: It is generated by default according to Chart Data settings. Users can customize it according to their needs.
    • Call-out: Check Show Call-out to display call-out on the chart. Users can display the call-out on the right or bottom of the chart.
    • Legend: Check Show Legend to display the data legends on the chart. Users can display the legend on the chart's top, right, or bottom.
    • Data Label: Check Show Data Label to display the data details on the chart.
  • Measure
  • Sliced by
  • Table Chart
    • The Table Chart can display the top N records of the report, where N can be specified by users.
    • The Table Chart can be sorted by one of the Report Columns in ascending or descending order.
    -