R12.1-JA-2025June05
Build Observability Dashboard from Intent Node
You can create a dashboard to view intent results.
- Click Build Dashboard and define the dashboard information.
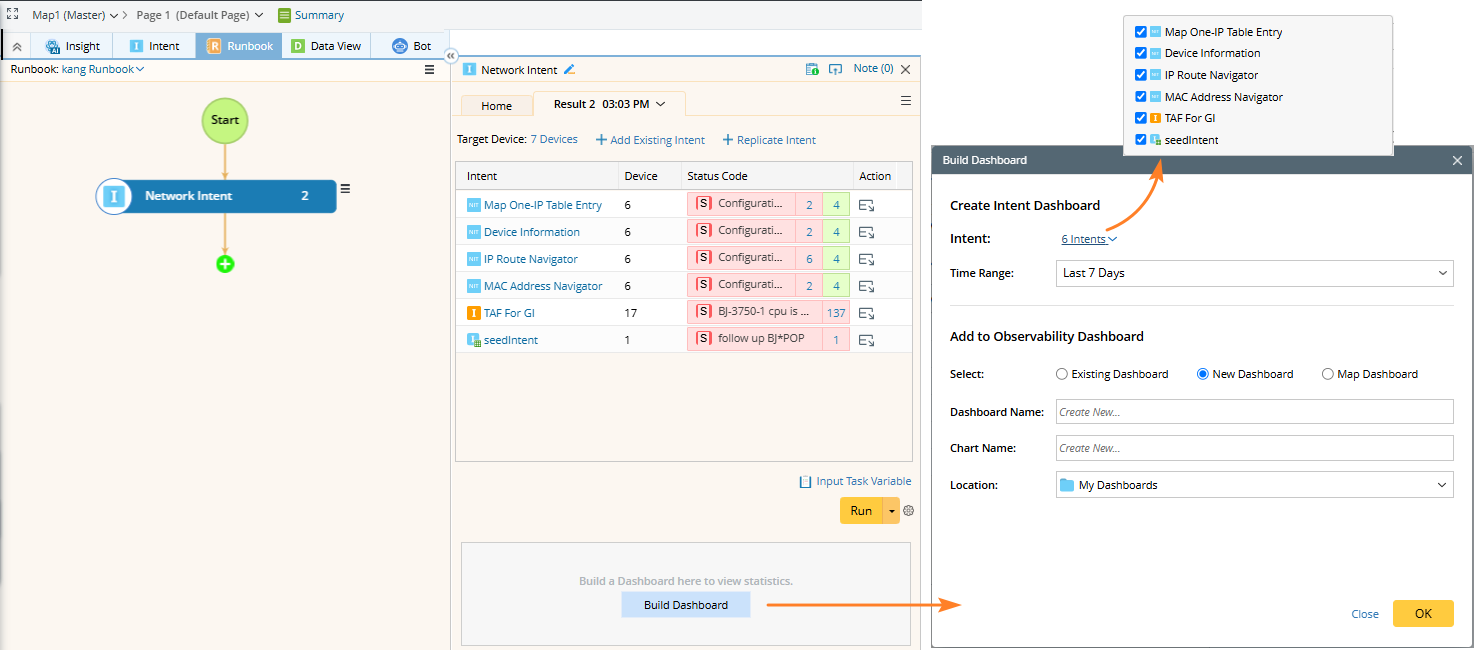
- By default, all intents are included, but you can uncheck them, ensuring at least one intent is selected.
- The New Dashboard radio is selected by default.
- By default, the Dashboard Name is empty, the Location is set to My Dashboards, and the Chart Name is empty.
- Click OK.
- View the created Dashboard.
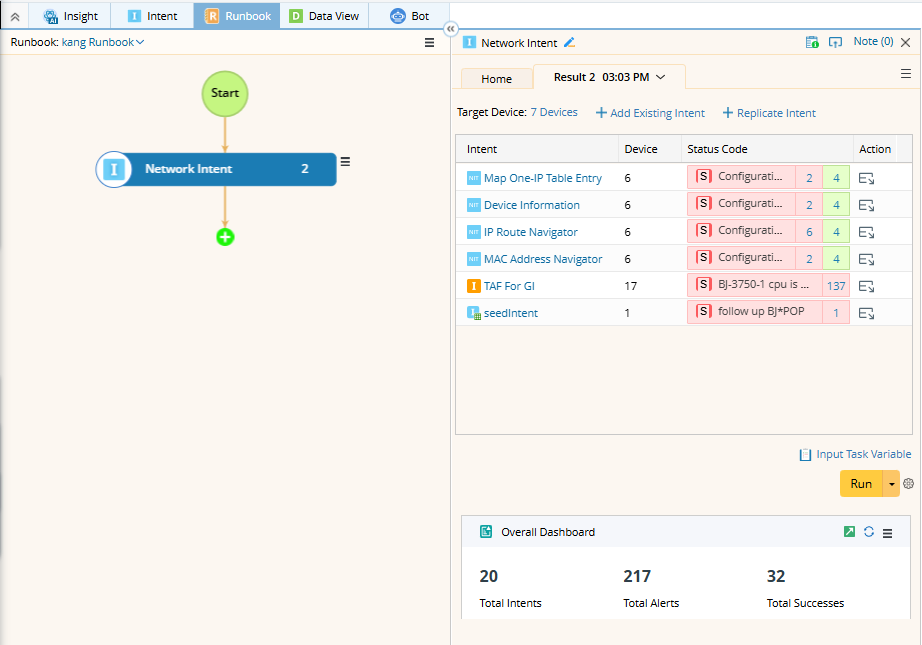
The observability dashboard's associated intent dashboard will be placed in a fixed folder Runbook Intent Dashboards.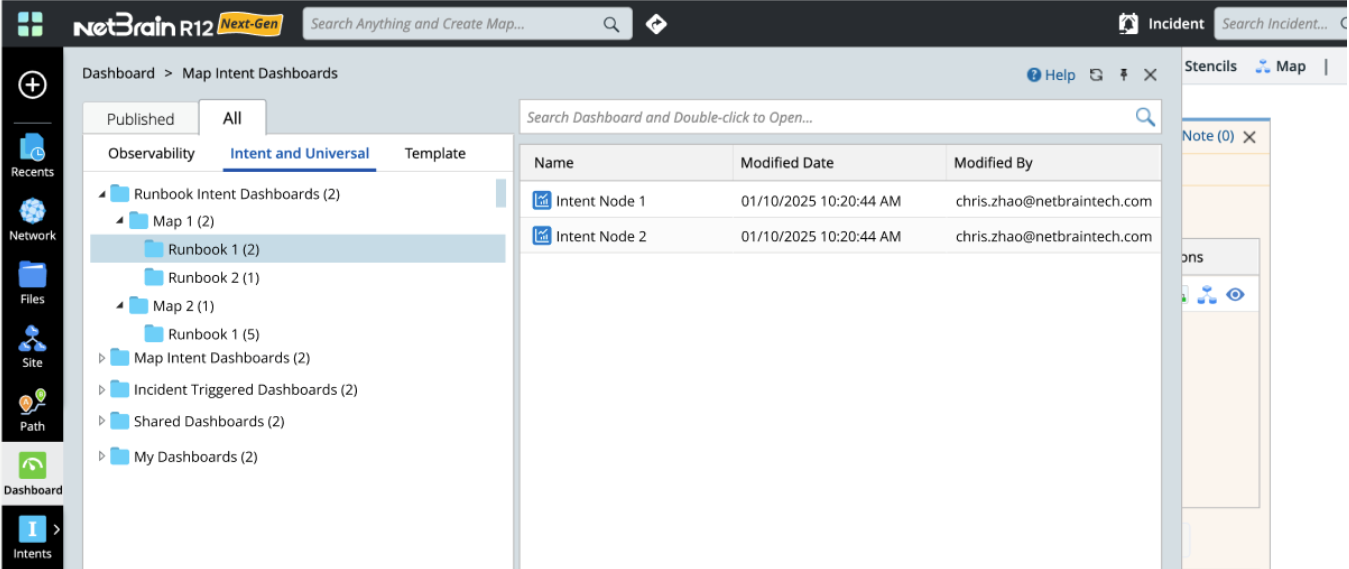
It is at the Intent node level and is not directly associated with each result. This means that even if multiple node results are generated from multiple runs, these results will be updated in the dashboard based on the dashboard time range settings.
Note: During the repeat run, the data from each execution will also be updated into the Dashboard. Note: The dashboard created from the intent node and its associated intent dashboard can only be manually cleaned up.
Supported Actions
You can perform the following actions for a dashboard:
- Open: Open the observability dashboard in a new tab in the browser.
- Refresh: Manually refresh the dashboard data and update the above three numbers.
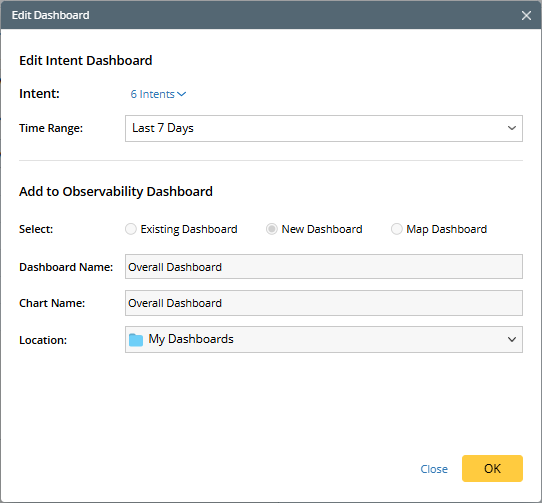
- Edit: Open the dashboard setting dialog. Only the intent setting and time range can be adjusted, while all other settings are disabled and cannot be modified.
- Delete: Delete or unlink the dashboard.
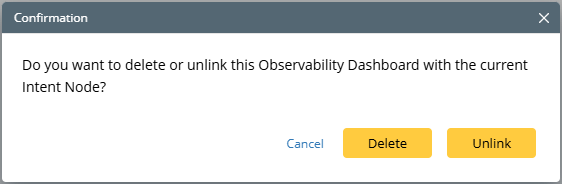
- Delete: Remove the observability dashboard but keep the intent dashboard.
- Unlink: Simply remove the association with this intent node but retains the observability dashboard.