10.1.15.12-06212024
Viewing and Understanding Execution Tree
Opening Execution Tree
- Go to
 on the desktop and search Preventive Automation Console, select the option from the results to open it.
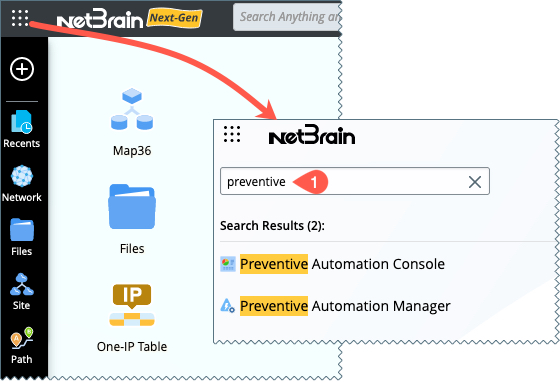
-
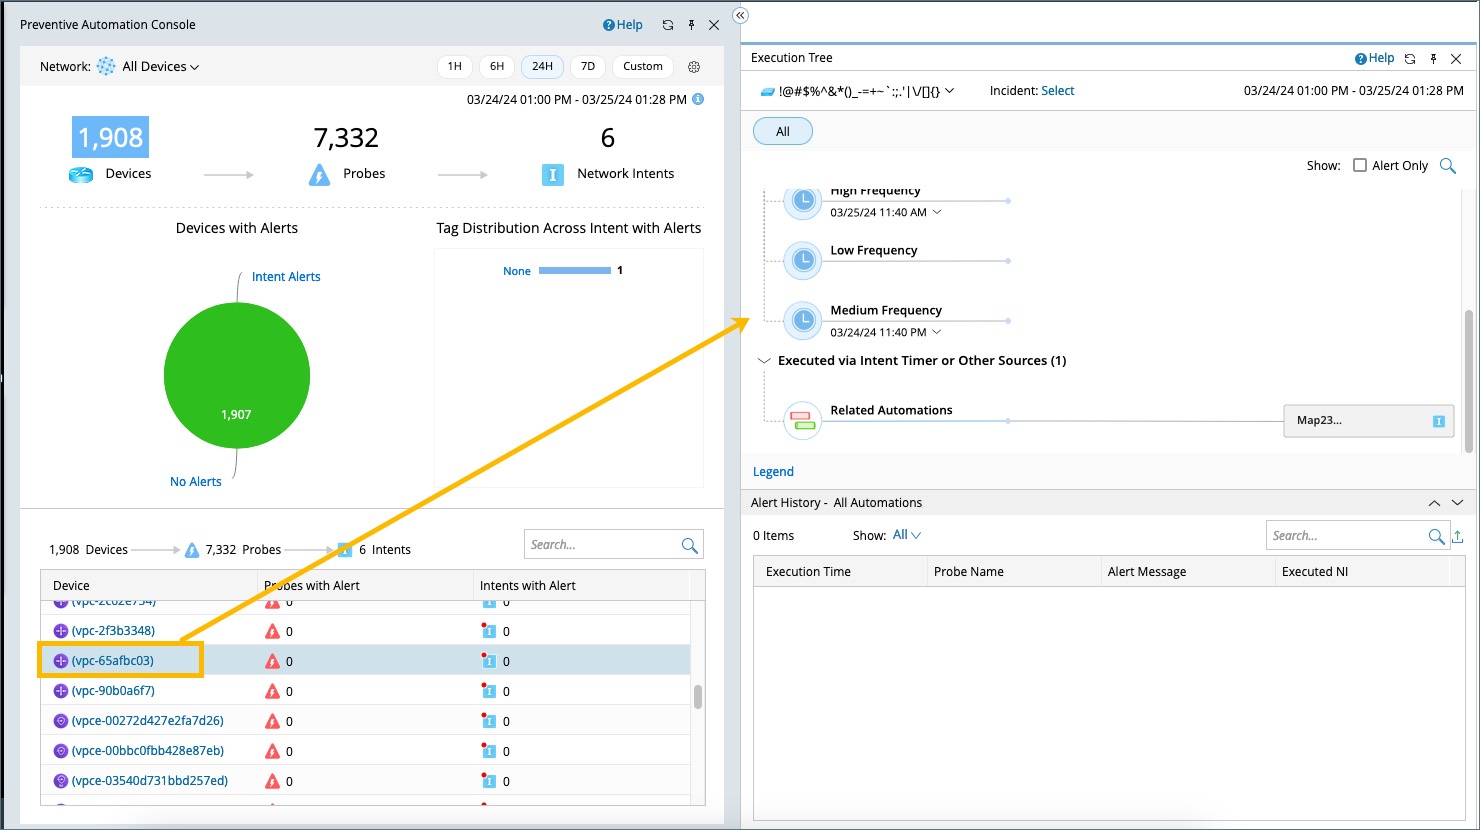
Click a device in the device list, and the Execution Tree will be activated.
 |
Note: The Execution Tree displays the preventive automation details of the selected device.
|
|
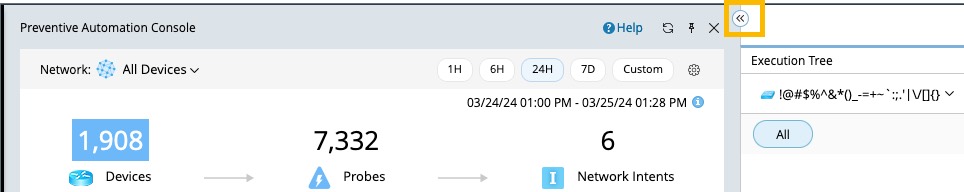
Tip: To view the Execution Tree side by side with the map, you can click  to hide the PA dashboard. to hide the PA dashboard.
|
Viewing and Understanding Execution Tree
- The Execution Tree will demonstrate all the probes and triggered intents for the selected device.
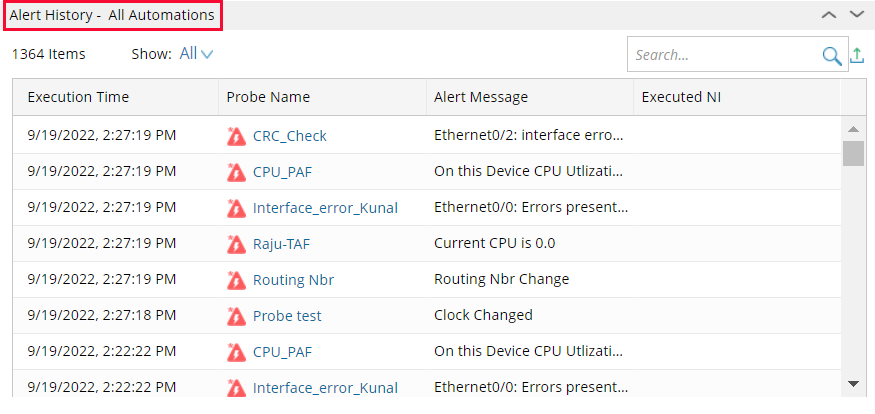
- The lower window shows the alert history during the selected time range.

| # | Meaning |
| 1 | You can select the latest or the historical execution results of the probe from the drop-down menu. |
| 2 | The tags of the network intent can be used to narrow down to the interested network intents. |
| 3 | You can quickly switch between different devices by using the drop-down menu. |
|
Tip: You can click on the probe icon and network intents on the Execution Tree, and the results in the Alert History window will be filtered based on your selection. |
See Also: