10.1.15.12-06212024
Viewing Alert History
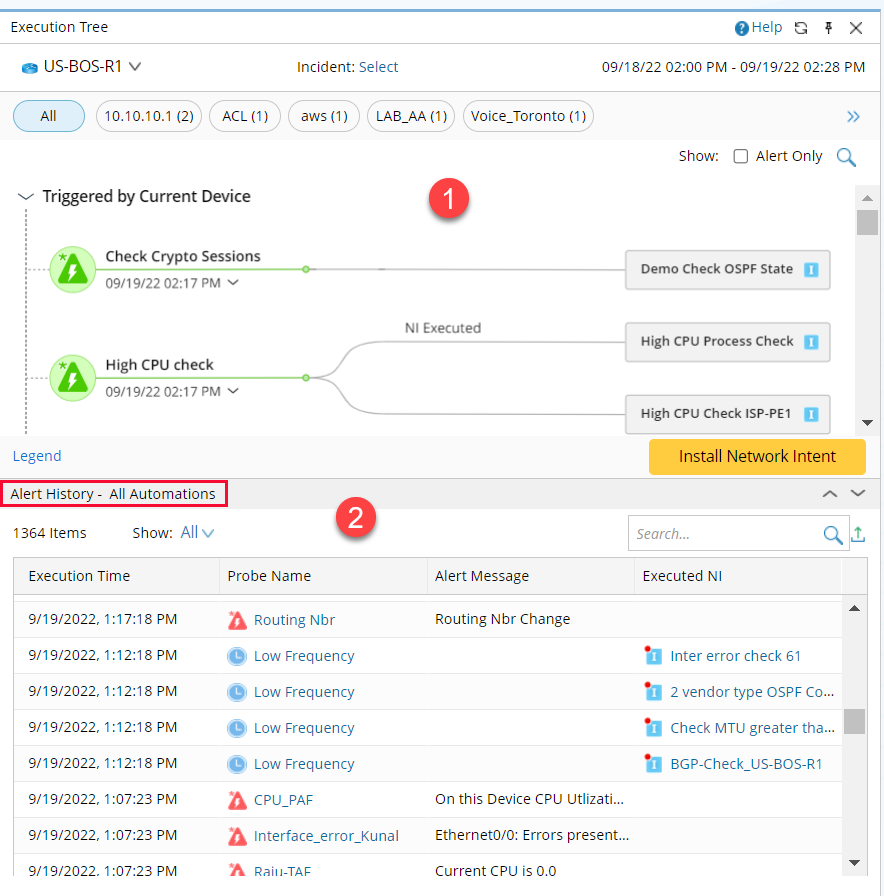
- The lower side of the execution tree displays the alerts generated during the selected time range.
-
Click the interested probe or network intent on Execution Tree, and the respective alert history will be displayed.
-
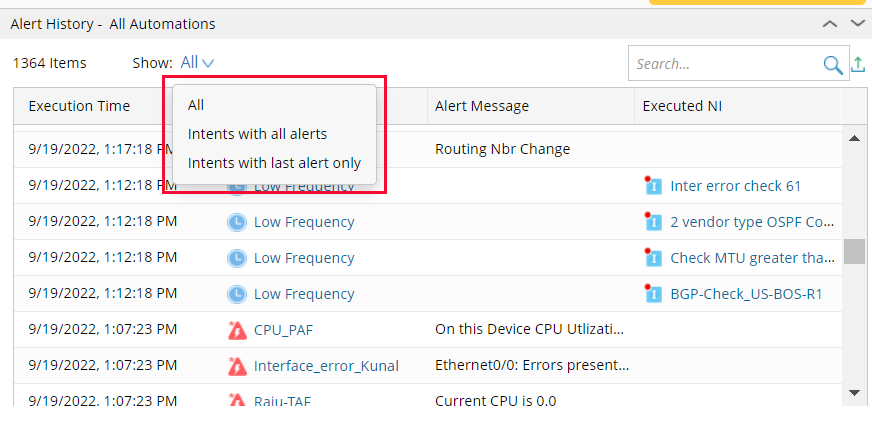
Use the drop-down filter to narrow down to the interested alerts:
- Intents with all Alerts: View the intent alerts generated for the current device.
- Intents with last alert only: view the latest intent alert for each intent.

|
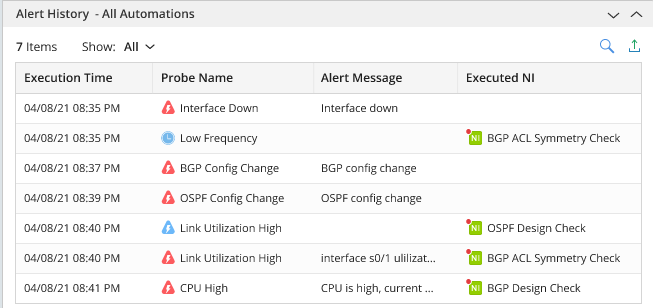
Note: The alerts generated by probes and network intents are sorted by the Execution Time. You can sort the Execution time by newest to oldest or vice versa by clicking the head of the column.
|
|
|
Note: When a network intent is shown in the same row as a flash probe, it indicates that the network intent is triggered by this flash probe. |
|
|
Tip: Clicking the Probe Name or Executed NI name, probe details or NI details will be displayed. |