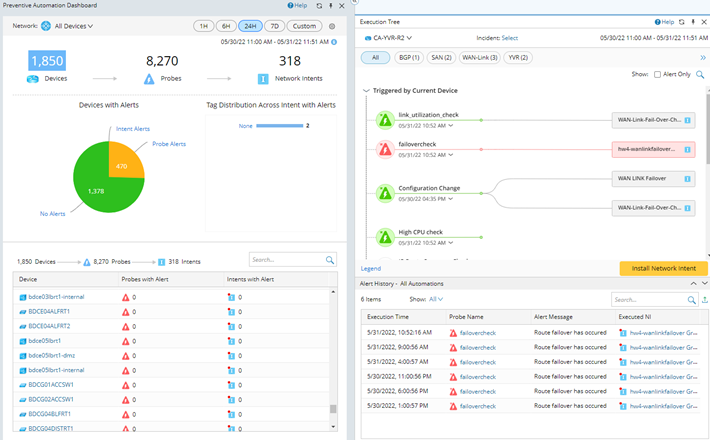
Using PA Dashboard and Execution Tree to Troubleshoot
Whether it’s daily routine check or an urgent troubleshooting task, with just a quick look at a PA (Preventive Automation) dashboard, all the key metrics of your current preventive automation can be reviewed. With the Incident Portal integration, you can now easily share the key findings that reside in the Execution Tree with their team members. The troubleshooting process, as a result, will be tremendously accelerated.
Follow the high-level steps below to start using your PA dashboard and sharing the findings for enhanced collaboration:
1.Define the device scope to view PA Dashboard results.
2.Select a specific device in the Execution Tree to view the execution details.
3.View the flash probe results and triggered intent results.
4.Share the key findings with your colleagues.

