Viewing Triggered Intent Results
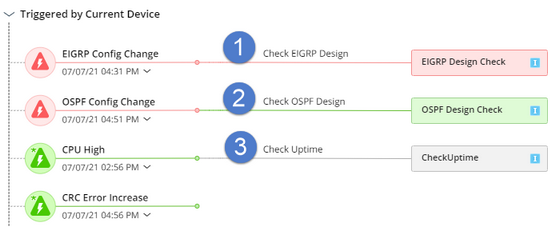
In the Execution Tree, each Flash Probe connects to multiple Triggered Intents. It essentially means the respective intents will be triggered when associated Flash Probe generates the respective flash alert.
Different color codes are used to differentiate various types of execution results:

# |
UI Description |
Meaning |
1 |
Rectangle and connecting line in red |
The error status code is generated by the Network Intent. |
2 |
Rectangle and connecting line in green |
The execution result for the Network Intent is normal. |
3 |
Rectangle and connecting line in grey |
The status of Network Intent is unknow. Either it was not executed during the selected time range or no status code defined to identify the status. |
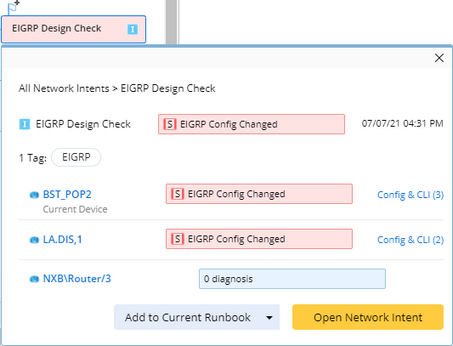
You can click a specific triggered automation to view its detailed information including:
•The name of the network intent and the associated device’s name
•The Network Intent Tag
•The Network Intent status code
•Device status code
•Execution time of the Network Intent
Tip: To execute Network Intent interactively, you can add NI to the current Runbook by clicking Add to Current Runbook.

