Define Call-out
- Provide additional details that are not obvious from the chart.
- Highlight important data or trends in the chart.
Check the Show Call-out option in the Edit Widget window to display the call-out in the Dashboard pane. Click on the pencil icon to define the call-out.
You can define a metric call-out or a table call-out.

|
Note: Only one type of call-out is allowed for each chart. |
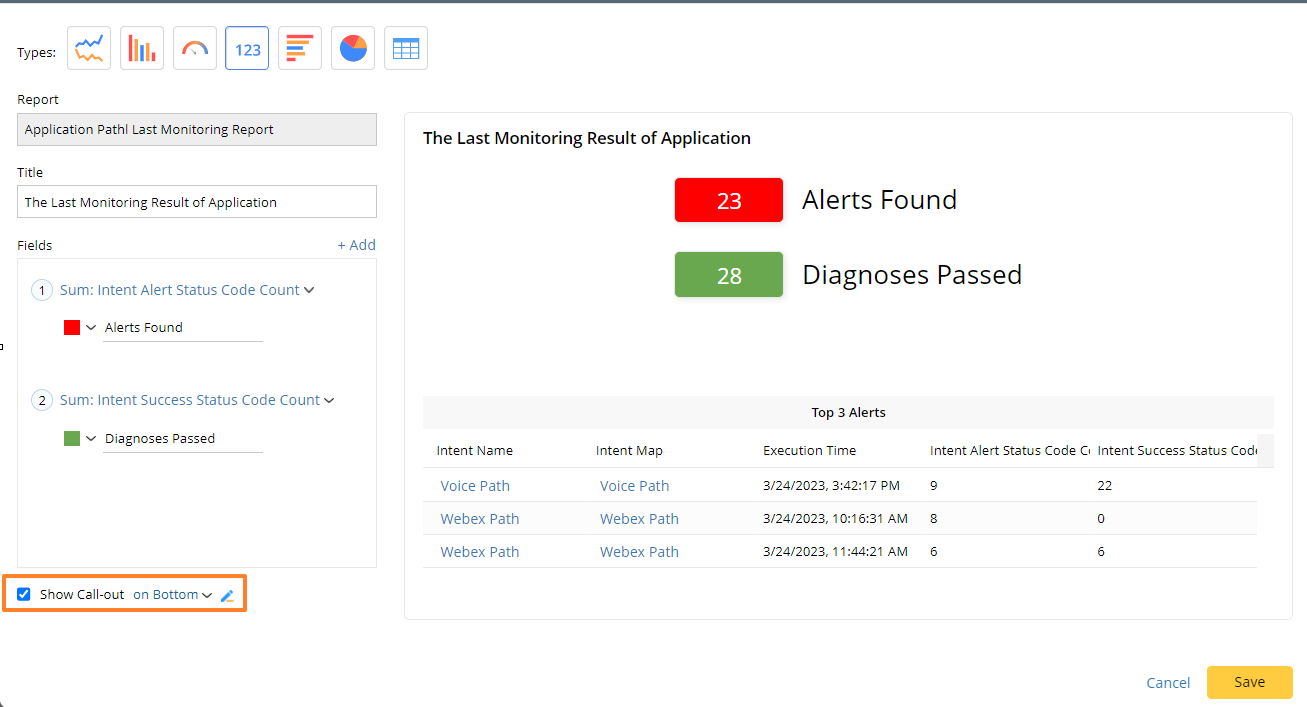
Define Metric Call-out
This type of call-out displays numerical data along with their corresponding units of measurement. It helps highlight important data in a clear and concise format. 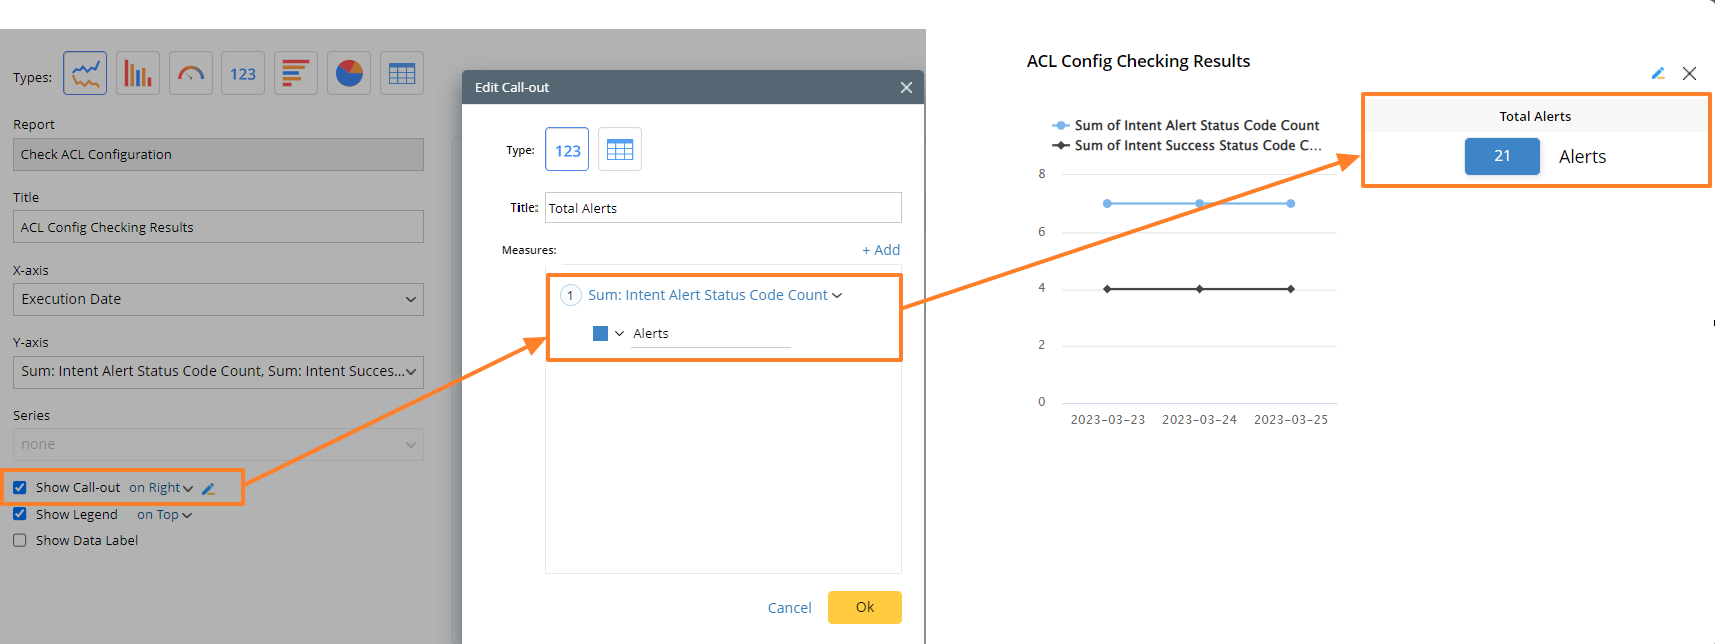
Select the Metric Chart as the format in the Edit Call-out window to define a Metric Call-out. There are two key elements for Metric Call-out:
- Title – Title is a descriptive label on the top of the Call-out. It helps provide an overview of the content or purpose of a call-out.
- Measures - Fields are the data displayed in the Metric Call-out. Each Metric Call-out can have up to six Fields, while each Field displays one summarized data from the report. You can define a background color and label for each field to help annotate the data.
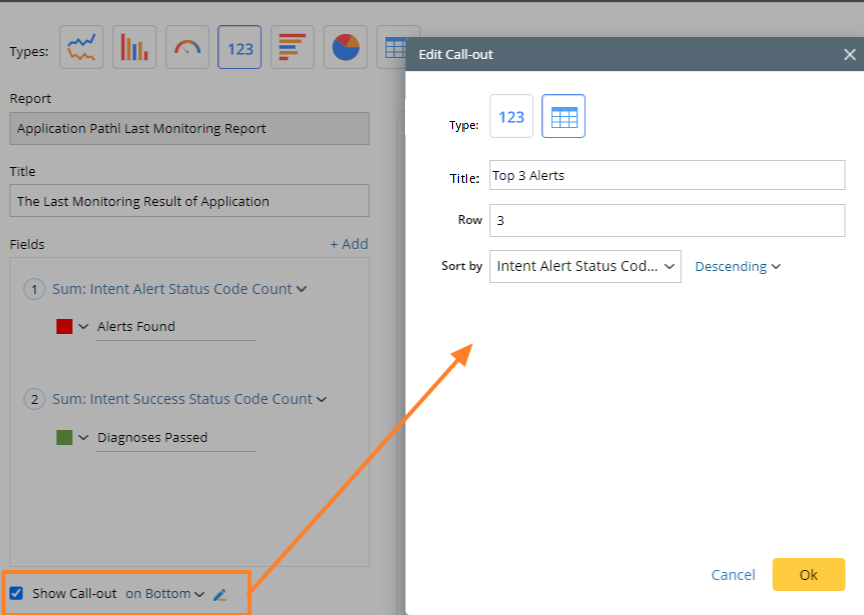
Define Table Call-out
This type of call-out displays the top-N records of the original report. It helps provide additional details for the chart.
To define the Table Call-out, select the Table Chart as the format in the Edit Call-out window. There are three key elements for a Table Call-out:
- Title – Title is a descriptive label that helps provide an overview of the content or purpose of the call-out.
- Row - Row defines how many rows of data appear in the Table Call-out.
- Sort by – Sort by defines by which report column the report data is sorted. You can choose to sort it in ascending or descending order.