R12.1 Project Publication-2025Dec23
View Golden Intent Pane
The left pane of the Golden Intent contains:
View History Results by Timeline
The timeline in the left pane reflects the actual execution time of the member intents, you can adjust the timeline to see more results as follows:
- By default, the vertical line is positioned at Now on opening the intent.

- You can hover on the timeline and a vertical line will move following the mouse.
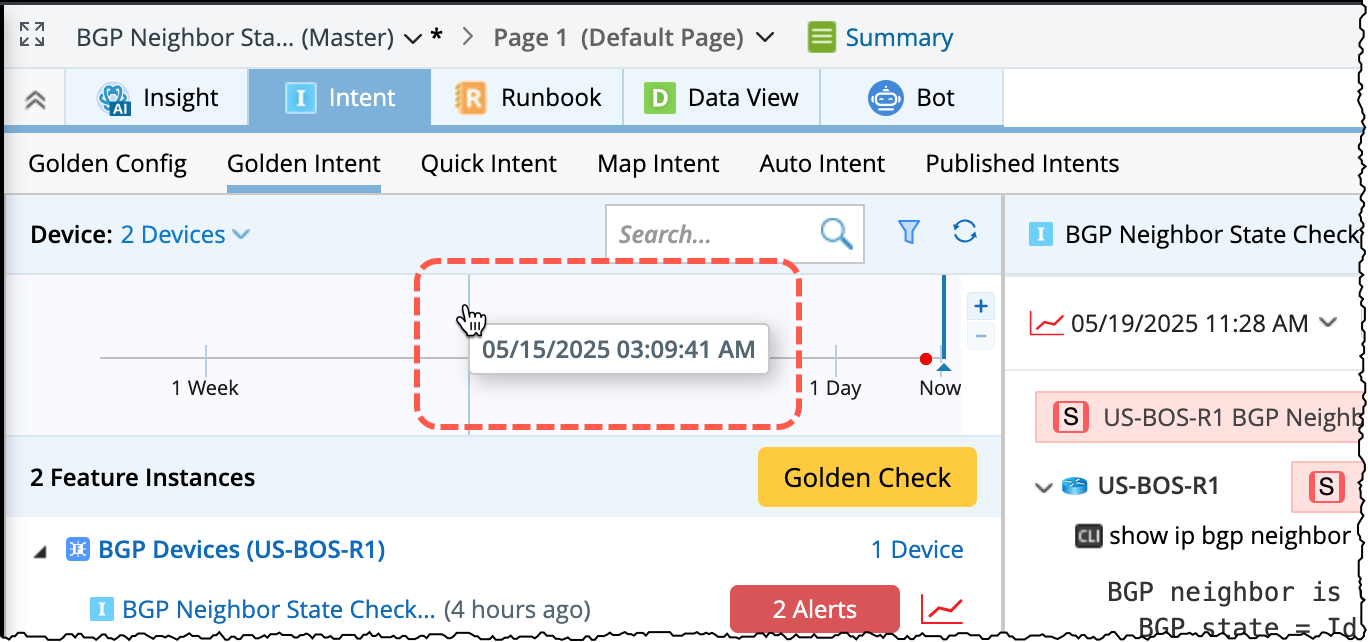
- Double-click at a time point to select the position.
(or)
Click and drag the mouse to move the timeline.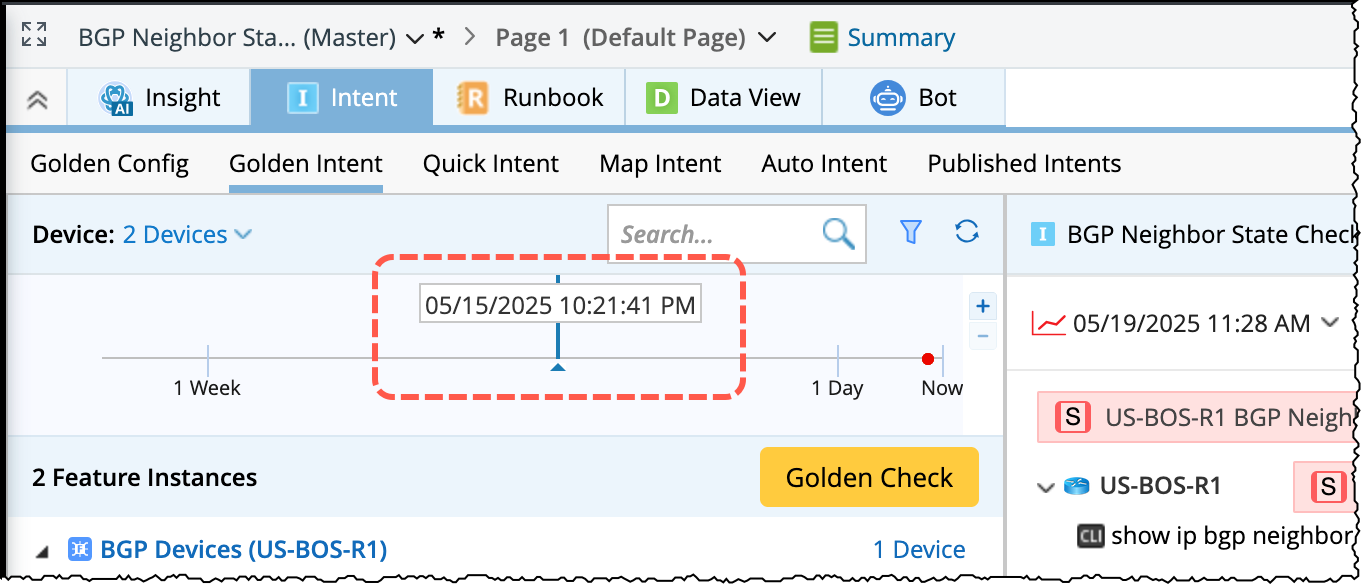
- The timeline can be zoomed in/out by scrolling the mouse or by using
 or
or  located next to timeline.
 - If there are alerts in the result, the dot is red, otherwise, it is green.
- The execution time and status code count listed after the intent name is the latest execution result of the selected position. The status code count includes the intent-level and device-level codes.

- Click the chart label behind the intent to view the history results of the status code dialog.

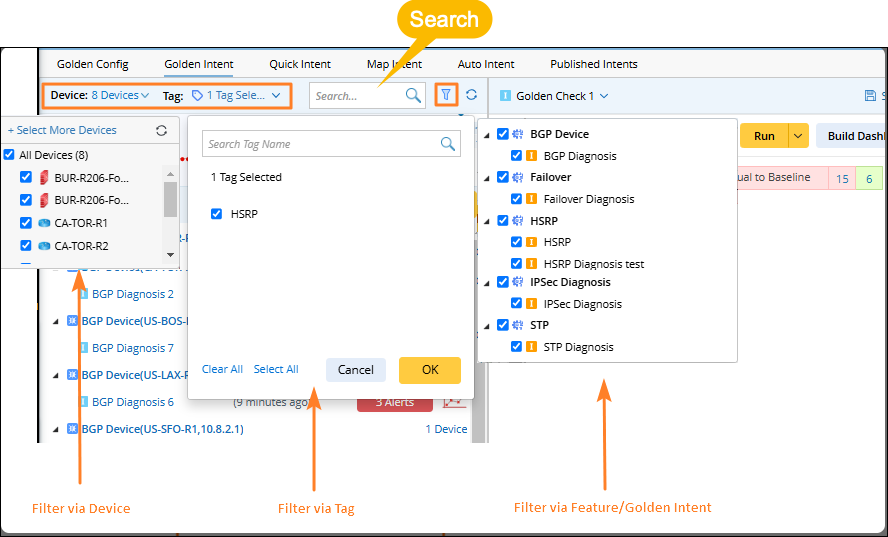
Filter Intents
You can filter the intents via the device, automation tag, and feature/golden intent as follows:
- Device: List map devices by default, you can select the devices from list and add other devices as well using +Select More Devices. And the member intents will appear as per the device selection.
- Tag: All the automation tags owned by the member intents are listed by default, you can further filter them.
- Feature/Golden Intent: All the features/golden intents owned by the feature instances/member intents are listed by default, you can further filter the intents.
- Search: The feature instance name/member intent name can be searched.
View Feature Instances and Member Intents
To view the detailed information of a feature instances and Member Intents:
- Select a feature instance in the left side pane and the following information will be displayed in the right side pane:
- List all the eigen variable and its value.
- List all the related device and its roles.
- You can click the
 icon to draw the device to the map, if it is not present on the map.
- Click the member intent name to perform the following operation in the right pane.
- Run the intent and see the execution results.
- Click
 to open the results on map.
 - Build Dashboard.
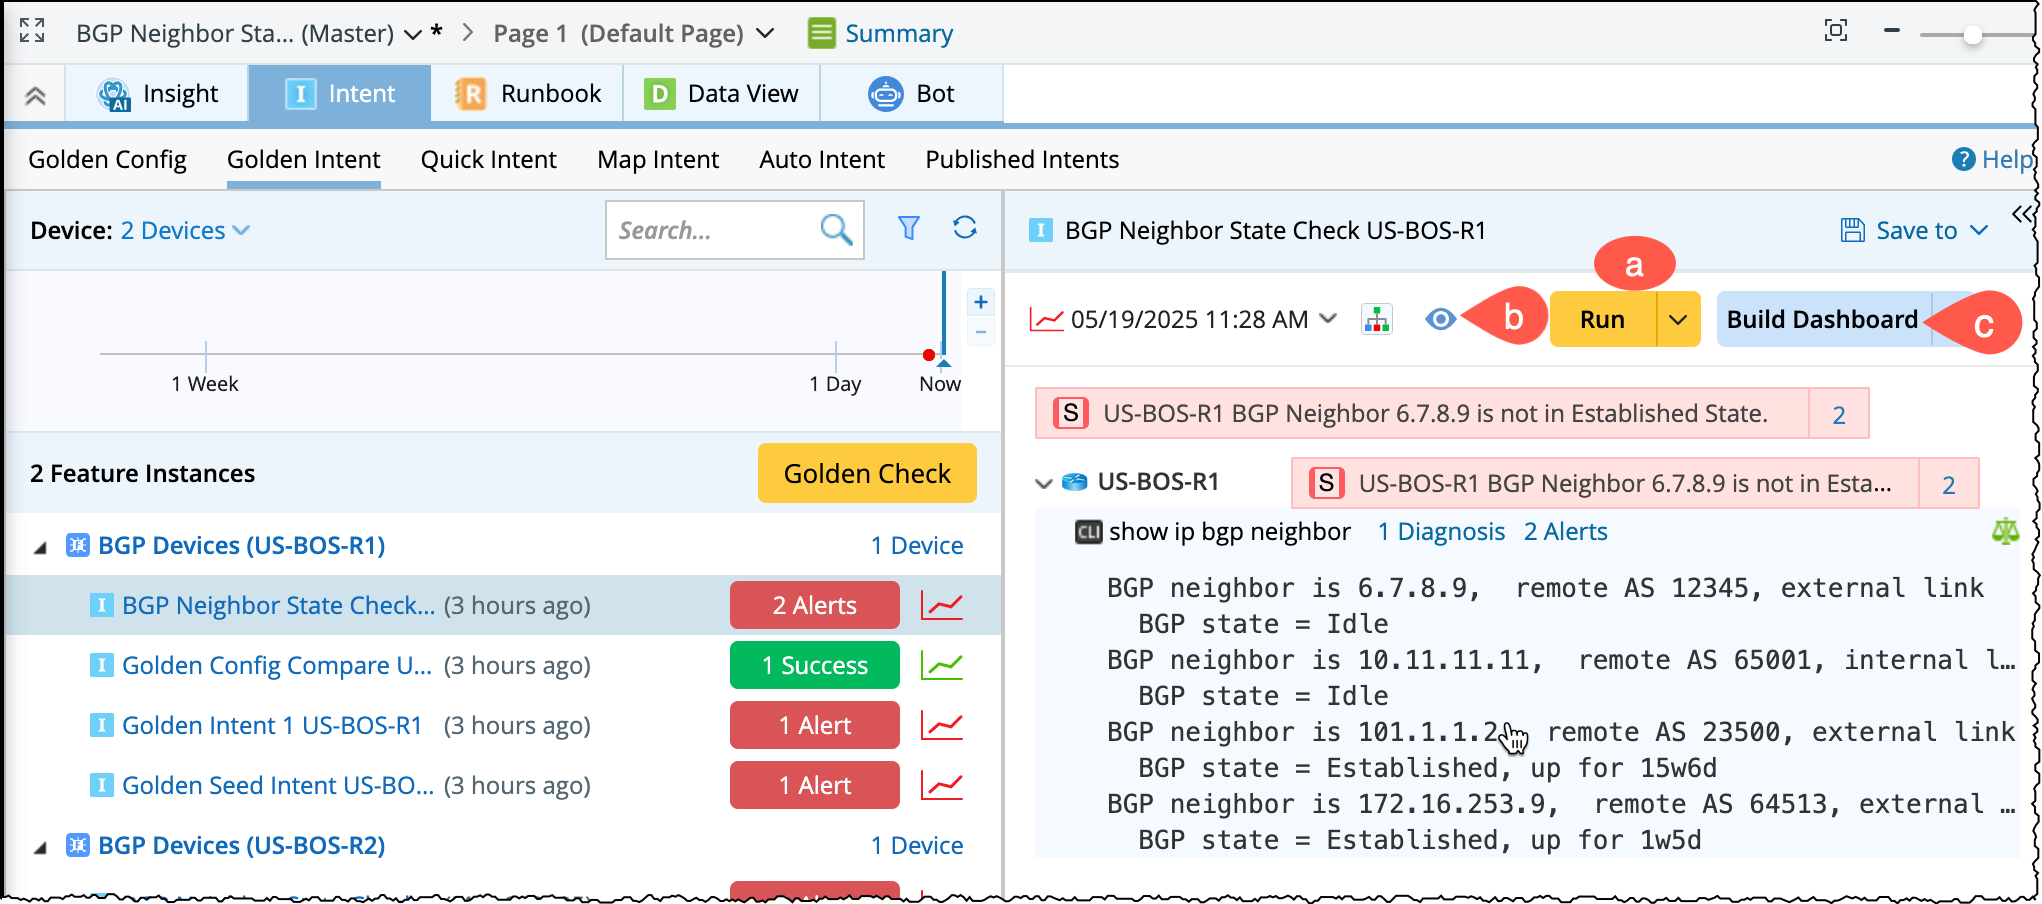
- You can do more on the left Feature/Intent pane:
- Hover on an intent, the Run button is displayed to directly run the current intent.
- The time after the intent shows the time of the closest run to the vertical line, and the count of alerts/successes for that run is also displayed.
- Hovering on an intent will display the absolute time.
