R12.1 Project-2025Sep08
Build Observability Dashboard from Intent Node
Creating and Managing an Intent Dashboard
You can create a dashboard to visualize and monitor the results of Network Intents over time. This dashboard enables observability across multiple executions and supports effective intent verification and analysis. To create a dashboard from an Intent node:
-
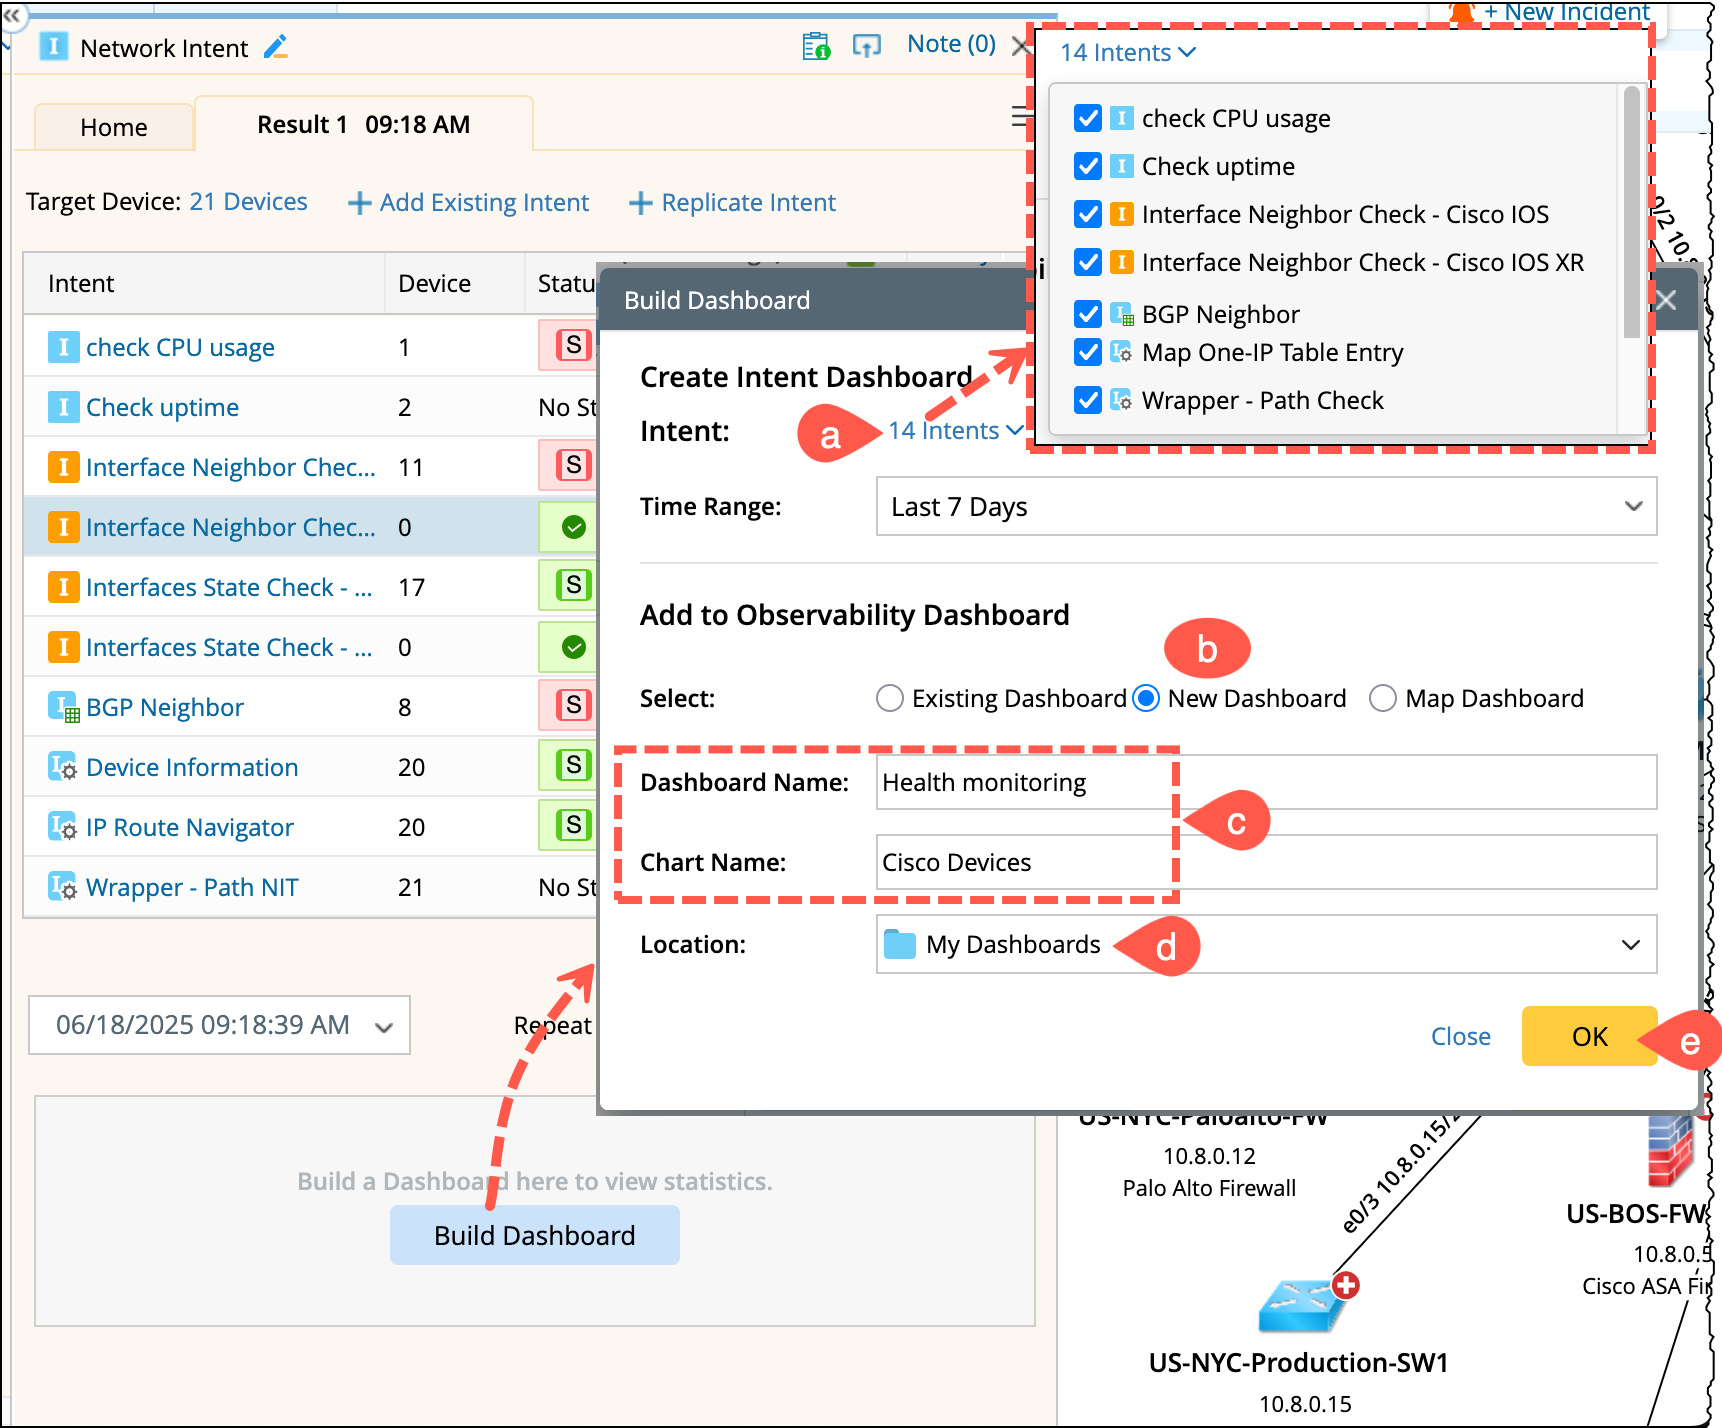
Click Build Dashboard from the Intent node. And in the corresponding dialog, configure the following:
- Intents: All intents are selected by default. You can deselect any, but at least one must remain selected.
- Dashboard Selection: By default, the New Dashboard radio button is selected. You can switch the selection to existing dashboard or map dashboard.
- Dashboard and chart Name: Enter a custom name.
- Location: Defaults to My Dashboards and the name is empty.
- Click OK to create the dashboard.
-
View the created Dashboard: It is created at the intent node level and not associated with each result. The dashboard displays results based on the defined time range, including all executions from Repeat Run operations.
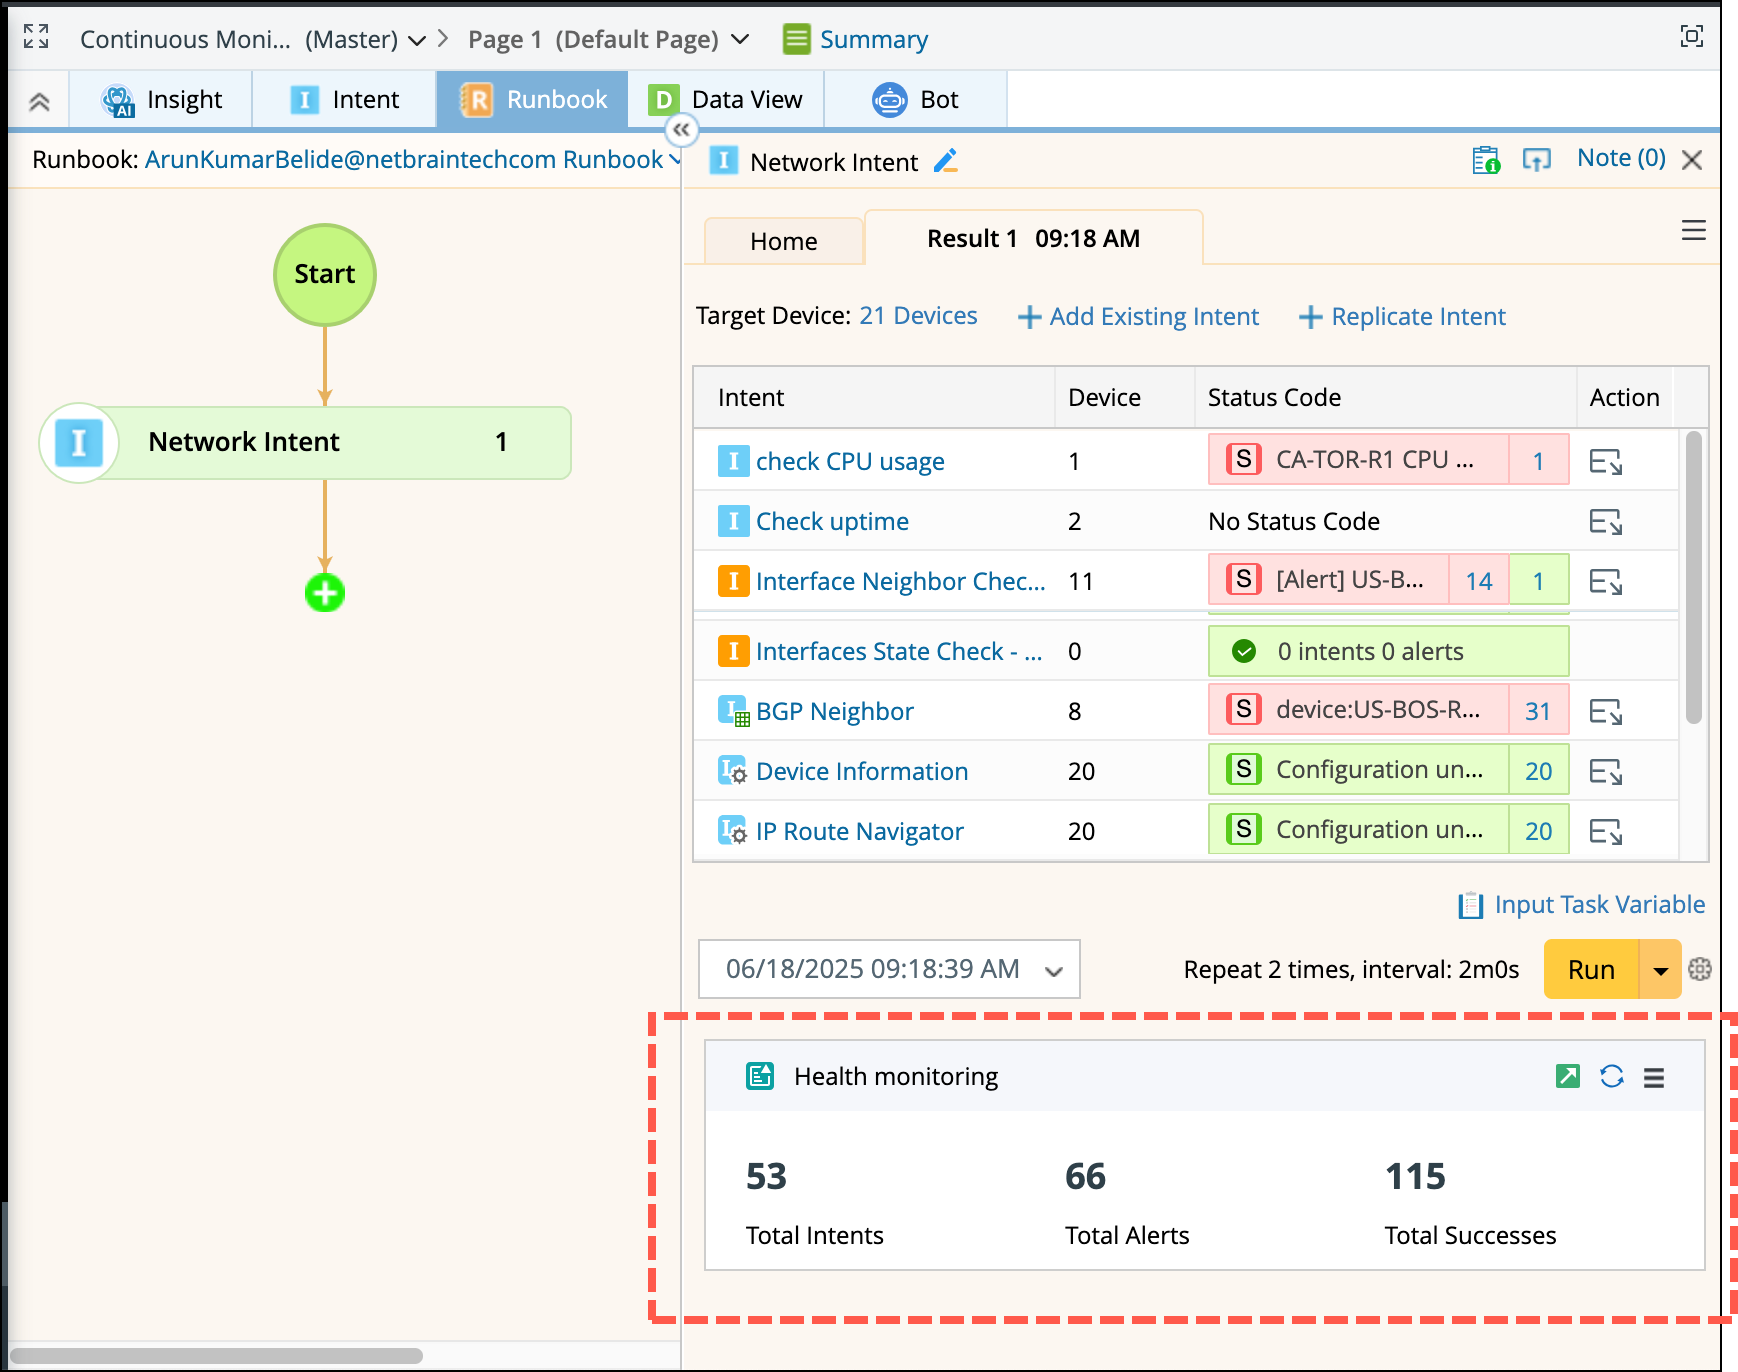
Dashboard behavior:
- The dashboard continuously aggregates data from all executions of the intent node.
- Repeat Run data is included automatically.
- Dashboards created from intent nodes must be manually cleaned up if no longer needed.
-
Supported Actions: You can perform the following actions on a dashboard:

- Open: Open the observability dashboard in a new browser tab.
- Refresh: Manually refreshes the dashboard and update the key metrics.
-
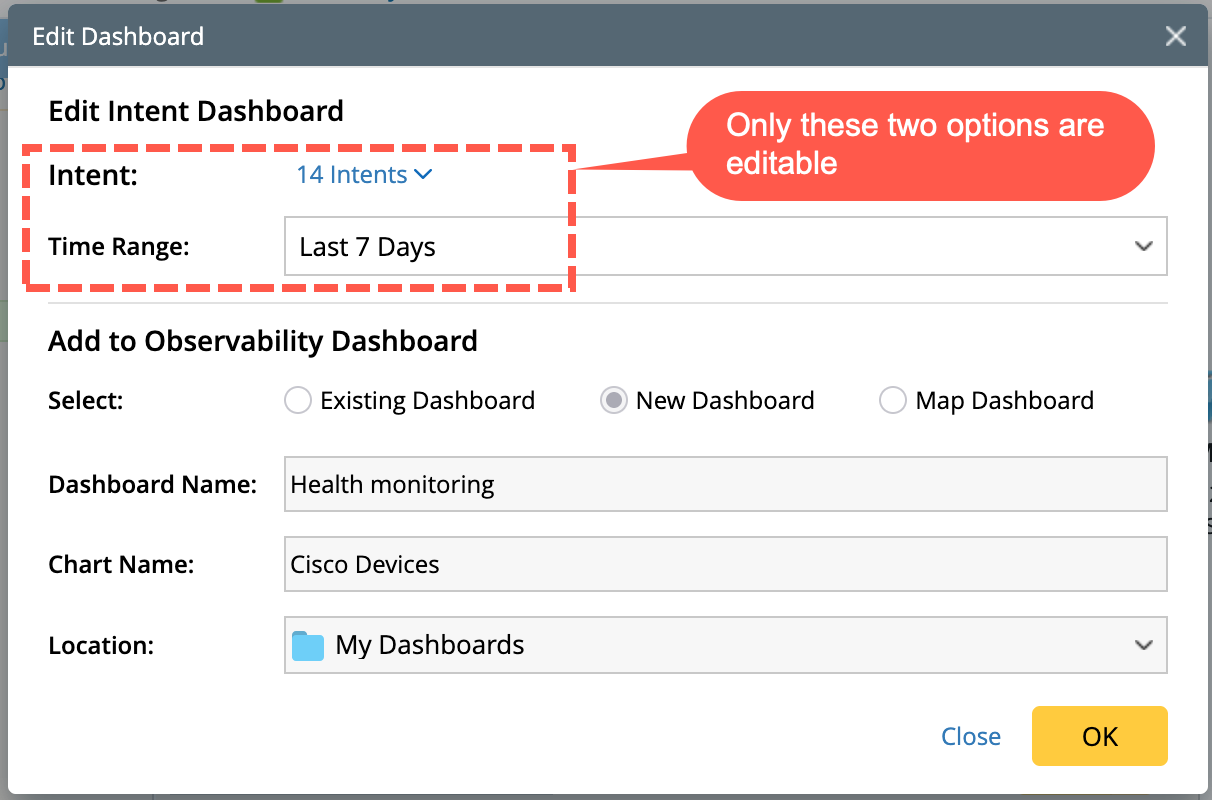
Edit: Opens the dashboard setting dialog. Only Intent selection and Time range can be modified, and all other settings are disabled.
-
Delete Confirmation: Delete or unlink the dashboard.
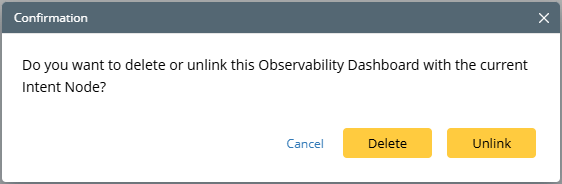
- Delete: Remove the observability dashboard but retains the intent dashboard.
- Unlink: Detaches the dashboard from the intent node, but the observability dashboard remains intact.
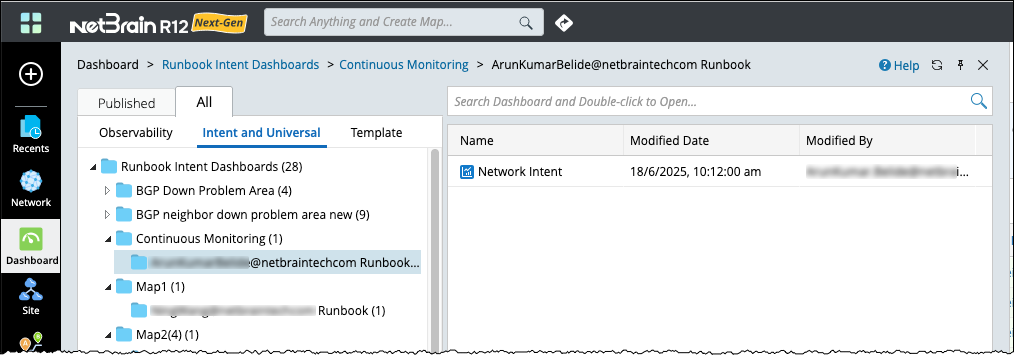
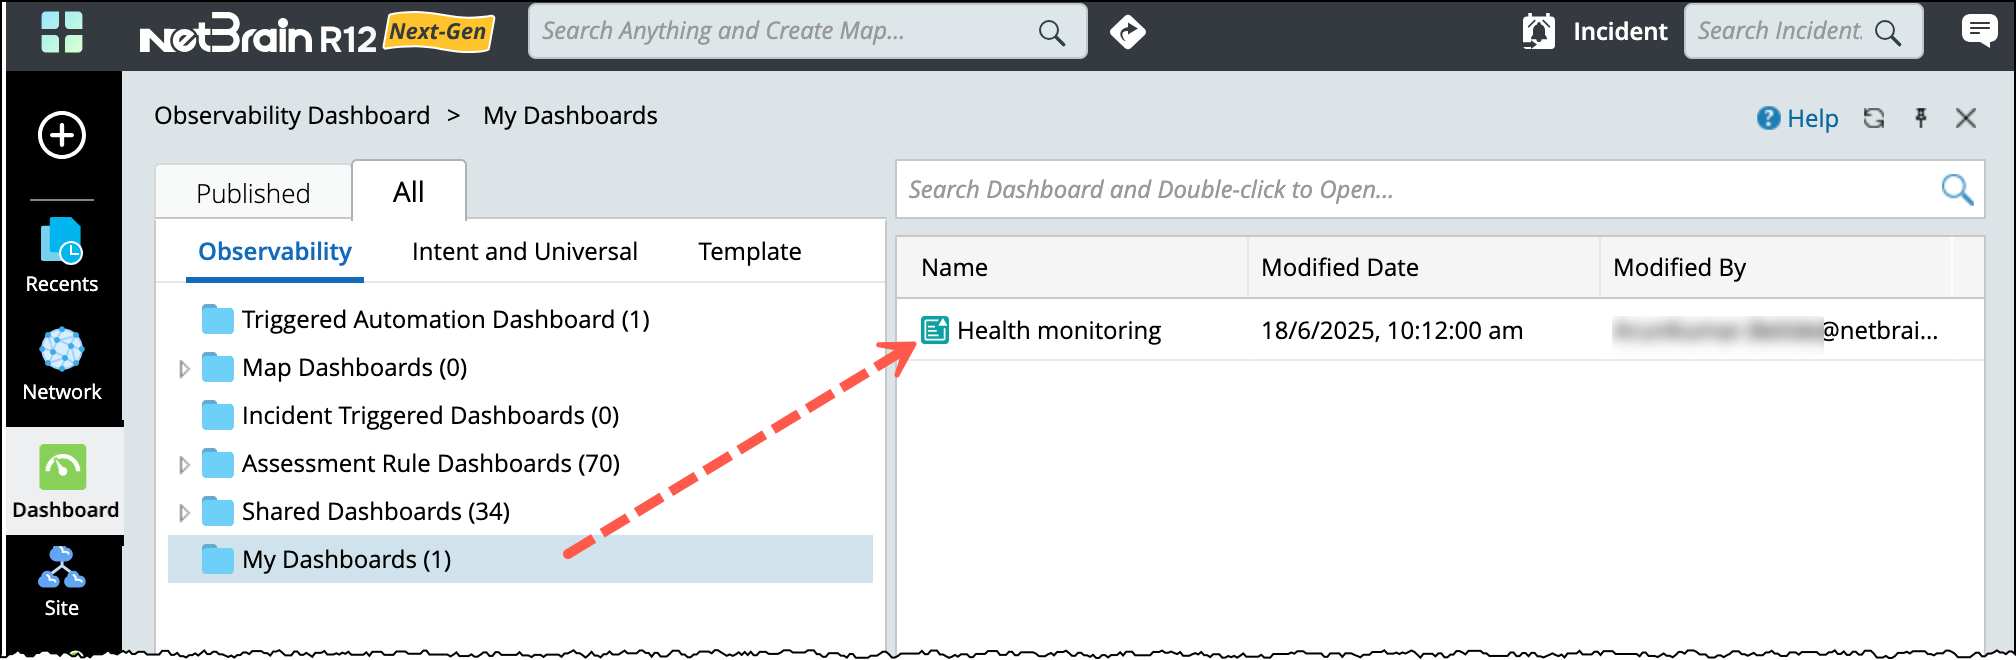
Dashboard Placement in Dashboard Manager
In the dashboard manager, the created dashboard will be placed under: The observability dashboard's associated intent dashboard will be placed in a fixed folder Runbook Intent Dashboards.
-
Observability Dashboards:
-
Runbook Intent Dashboards folder: