Data View
Data View represents a data structure to organize and visualize network information on the map, which can be used to decode a network design or troubleshoot a network issue. 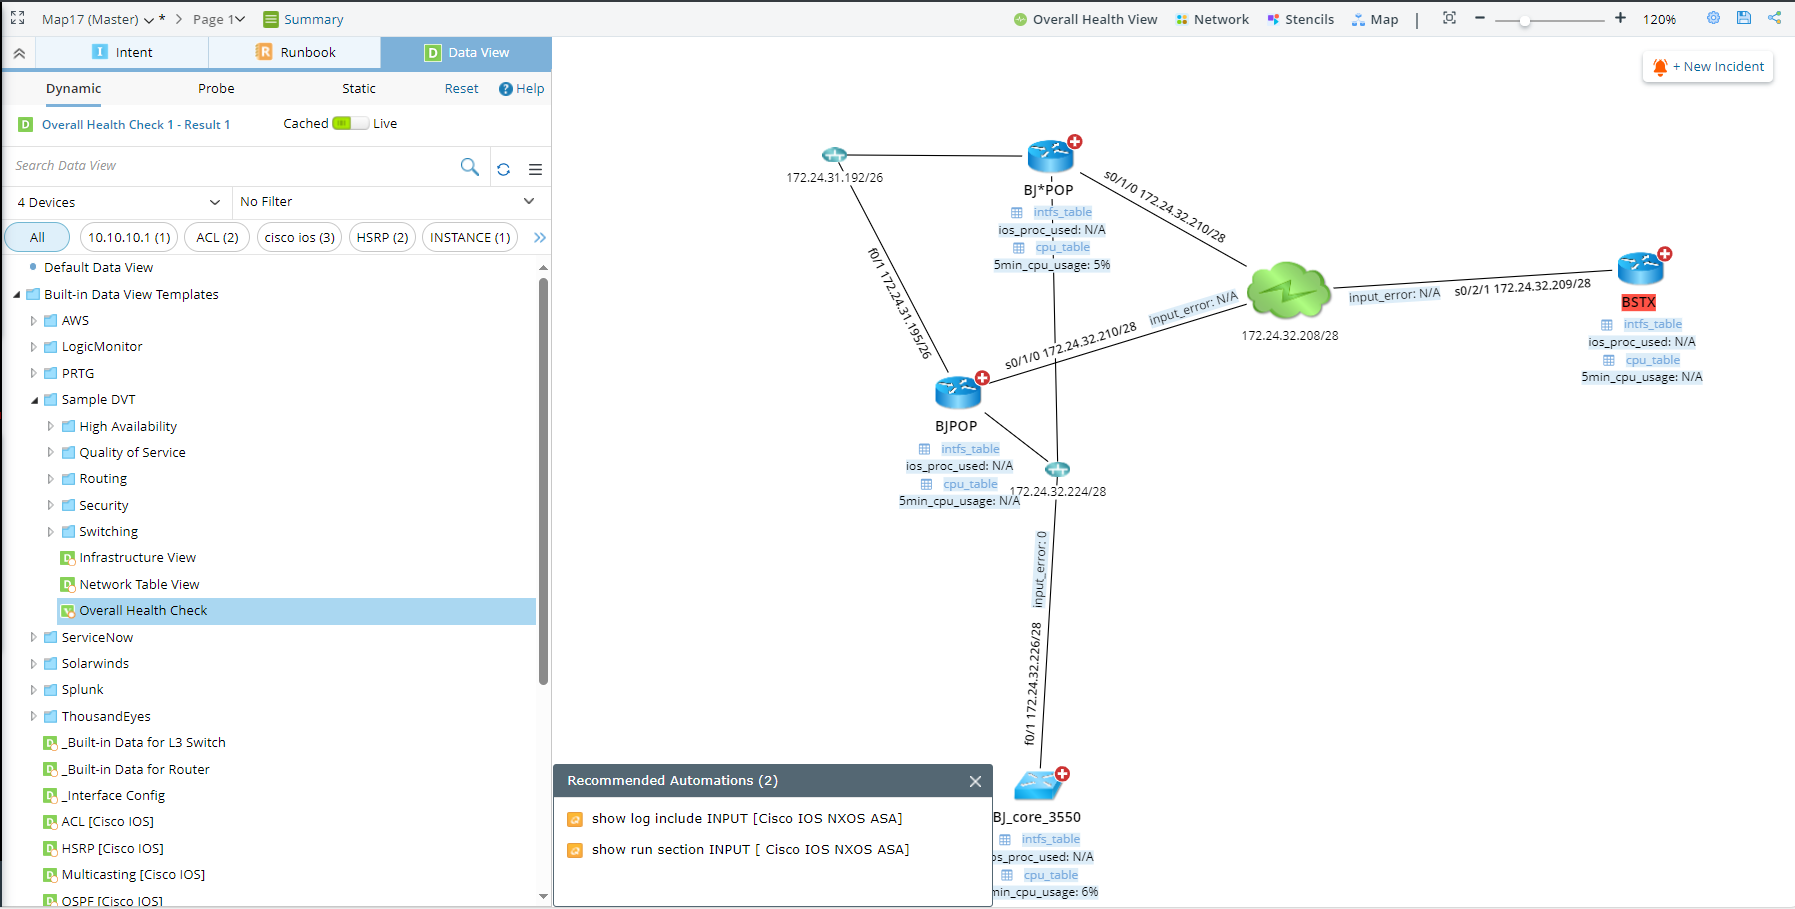
Through a dynamic data view, the system compares cached or live network data with Golden Baseline to address anomalies. Alerts can be visualized on a map and messaged to users through system notifications and emails. Then users can leverage the recommended actions to further drill down to troubleshoot for proper remediation. Actions and results will be documented in Runbooks and used to collaborate with colleagues and other teams.
Use Case
- Single Pane of Glass (SPOG)
The system can retrieve data from the live network or third-party systems via APIs and visualize the data through data views on a map. For the monitoring DVT, you can see the data chart and any anomalies against the golden baseline. After creating a data view template with an API parser, you can apply it and click a specific web link on the data view to directly go to the third-party systems for drill-down investigations and operations.
- Troubleshoot Network Issue
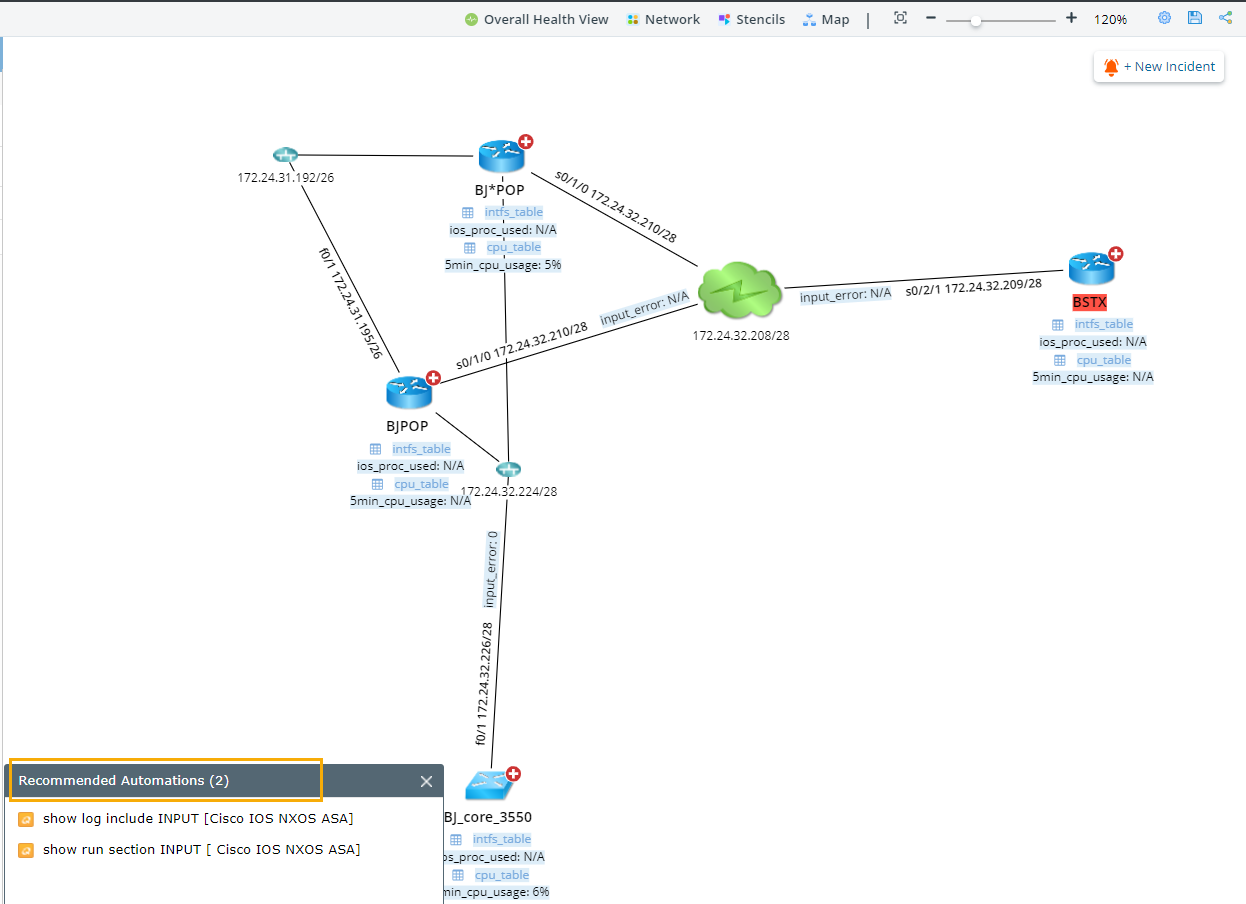
Based on the fundamental diagnosis, users can enclose suspicious devices that might cause the network issue in a small scope and easily proceed to the next troubleshooting level by executing the recommended automation on focused devices. When users execute the recommended automation, the actions alongside the execution results will be automatically recorded in a runbook. The runbook can be shared with other users for further collaboration and escalation. - Decode Network Design
Apply a static data view to a map and continuously edit the data view to make the visualized network data more accurate and valuable.
Data View Category
Data views can be categorized into the following types:
Dynamic Data View
Dynamic Data View refers to those data views generated by applying Data View Templates (DVT) to a map page. When a dynamic data view is selected and applied, the historical or live data is displayed to show the network design or operational status. The data is auto-compared against the golden baseline rule, and the data which does not match the rule are highlighted. The user can execute drill-down actions associated with a variable or a data view, such as CLI commands, Qapps, Single Pane of Glass, etc.
See Applying a Dynamic Data View to View Alert and Drill Down for more details.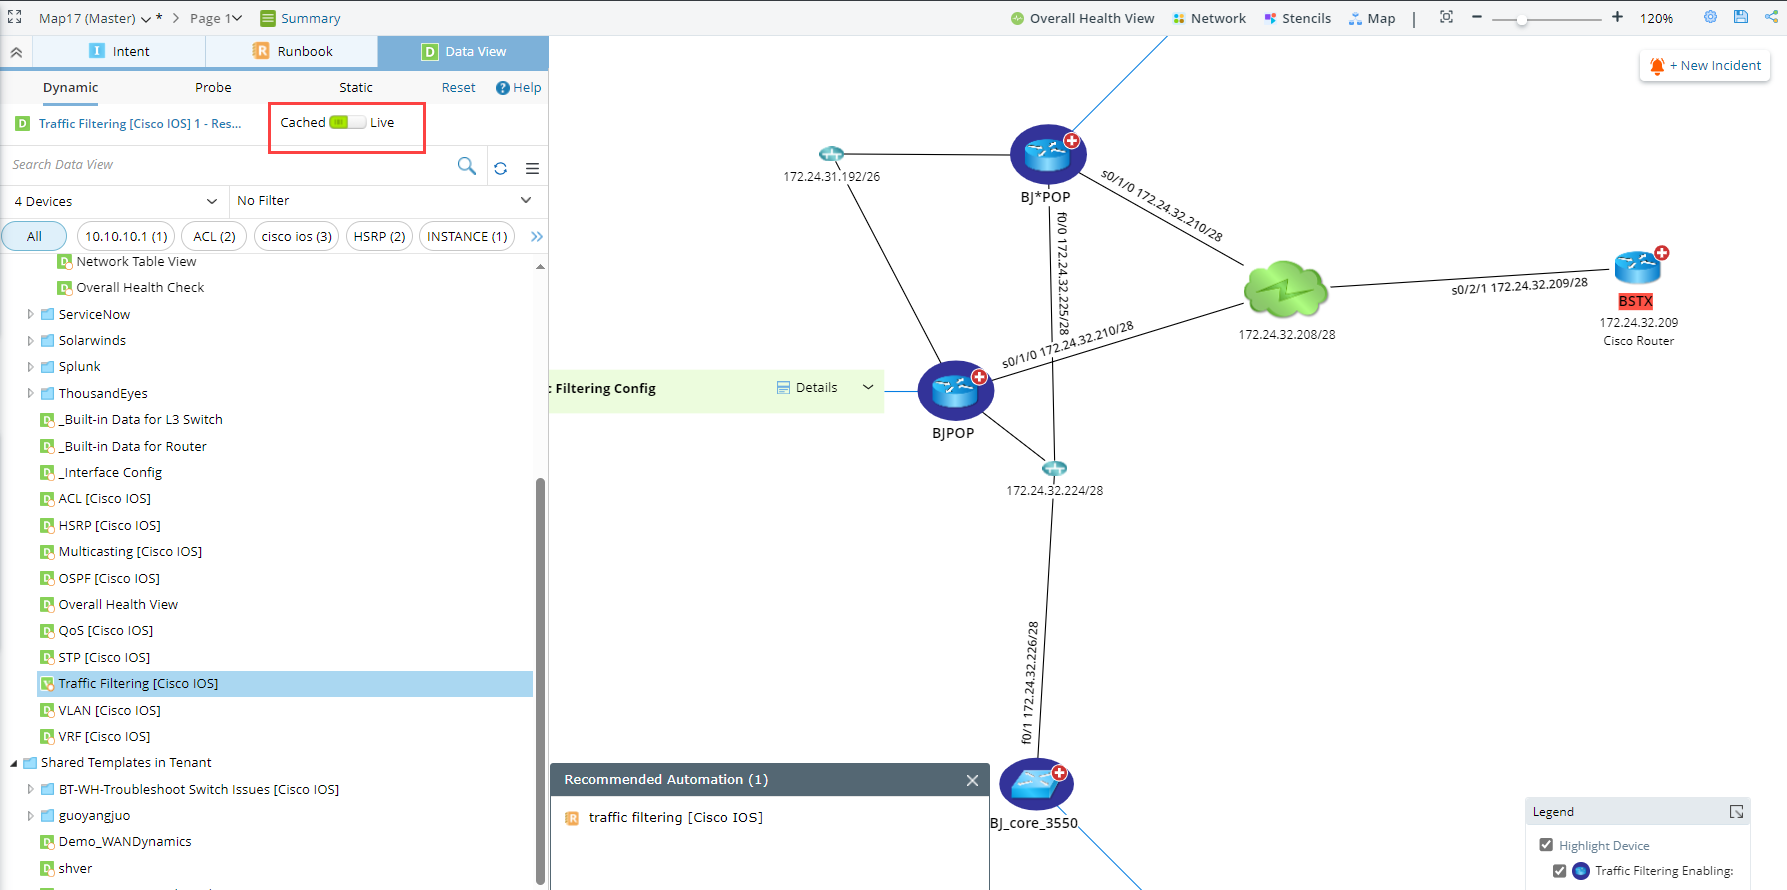

|
Tip: The  indicates the data view template has been scheduled to run; the indicates the data view template has been scheduled to run; the  icon indicates the data view template hasn't been scheduled to run. icon indicates the data view template hasn't been scheduled to run.
|
|
|
Tip: To pull live data in a data view, you can toggle the switch from Cache to Live. |
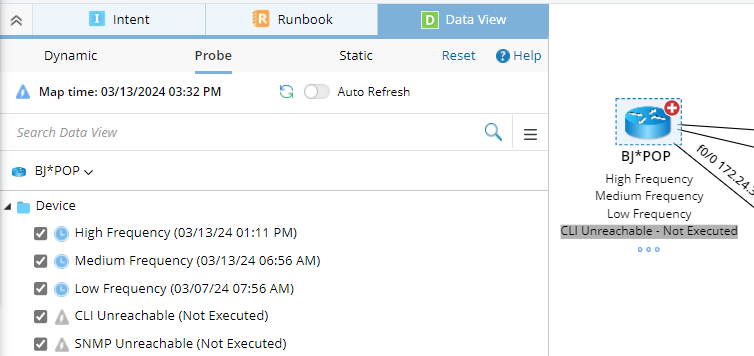
Probe Data View
Probe Data View refers to data views generated by applying the flash probes and variables enabled by the devices on the current map. You can get the latest flash probe and variable results by clicking ![]() .
.
Static Data View
Static Data View (SDV) is a snapshot containing device data at a particular moment.
SDVs can be generated by using the following ways:
- Run the scheduled Qapps or Gapps. You can browse these SDVs in the folder Scheduler.
- Apply a DVT and save it as an SDV.
- Edit an existing SDV or Map Data View, and save it as an SDV.
Map Data View
Map Data View refers to a data view saved within a map and can only be visible on the current map. It is generated by saving a dynamic/static data view.
To view Map Data Views, navigate to the Static pane.
|
|
Tip: You can hover over the highlighted area and click the corresponding icons to edit, delete, manage, and save as the map data view after the data view is applied. |
Default Data View
By default, devices on each map page are displayed in the default data view. Refer to Positions for Data Units for Default Data View for more details.
|
|
Tip: To update a default data view with the latest data saved in the database, you can configure it through a scheduled benchmark task. See Updating Default Data View for more details. |