Data View

Contents
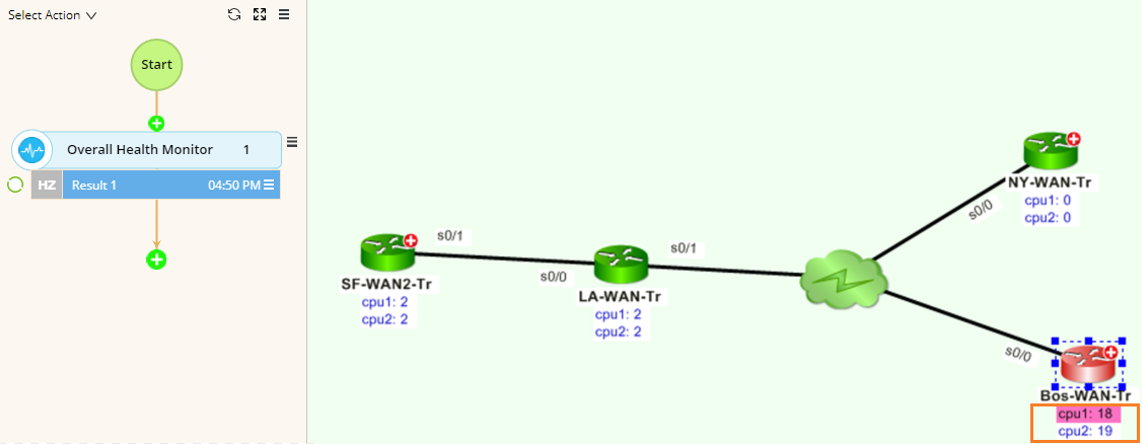
The Data View node is used to monitor devices and device interfaces by visualizing variable values on a map. It can highlight variable values in different colors and output alert messages when the variable values reach the predefined threshold.
Configuring a Data View Node
1.Point to the upstream table node that you want to analyze the variables.
2.Click the  icon and extend a Data View node from the table.
3.At the Data View node, click Select Data Unit. The Select Data View dialog opens. Define data units to display based on the Table type:

1)Select a device data table in the left pane. 2)Select the variables you want to display on the map. You can add device-level variables (such as CPU and memory) or interface-level variables (such as MTU and bandwidth). You can also select a table to monitor and display all variables in table format. 3)Click OK. |

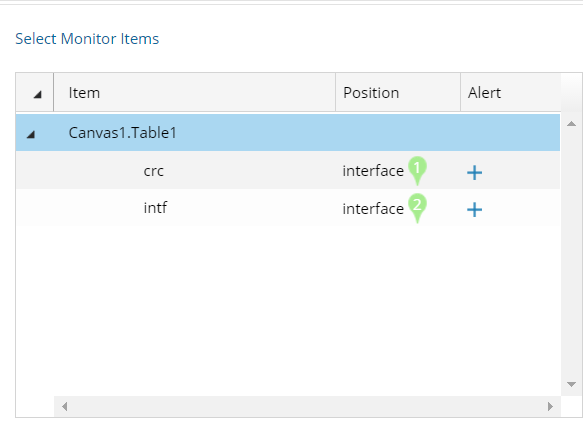
1)Select a global data table in the left pane. 2)Select the device variable (_device by default) from the Device drop-down menu. 3)Select the interface key from the Interface drop-down menu. 4)Select the variables that you want to monitor under the Variable list. |
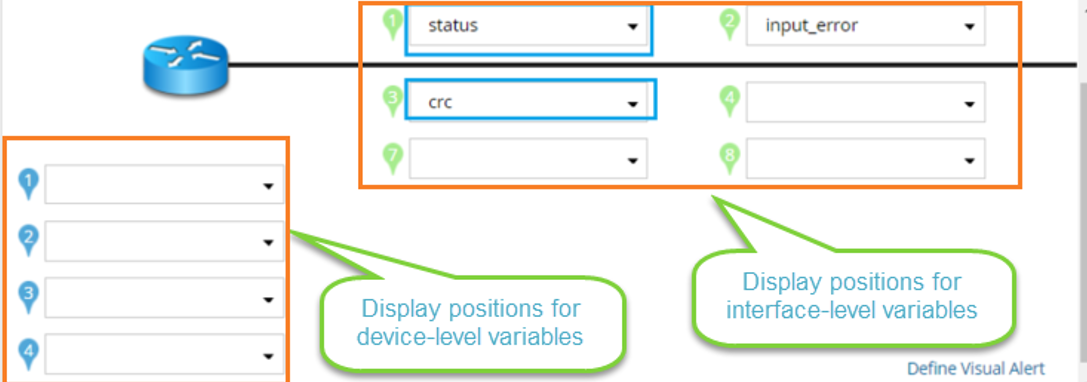
4.Specify the display positions for each variable on a map.
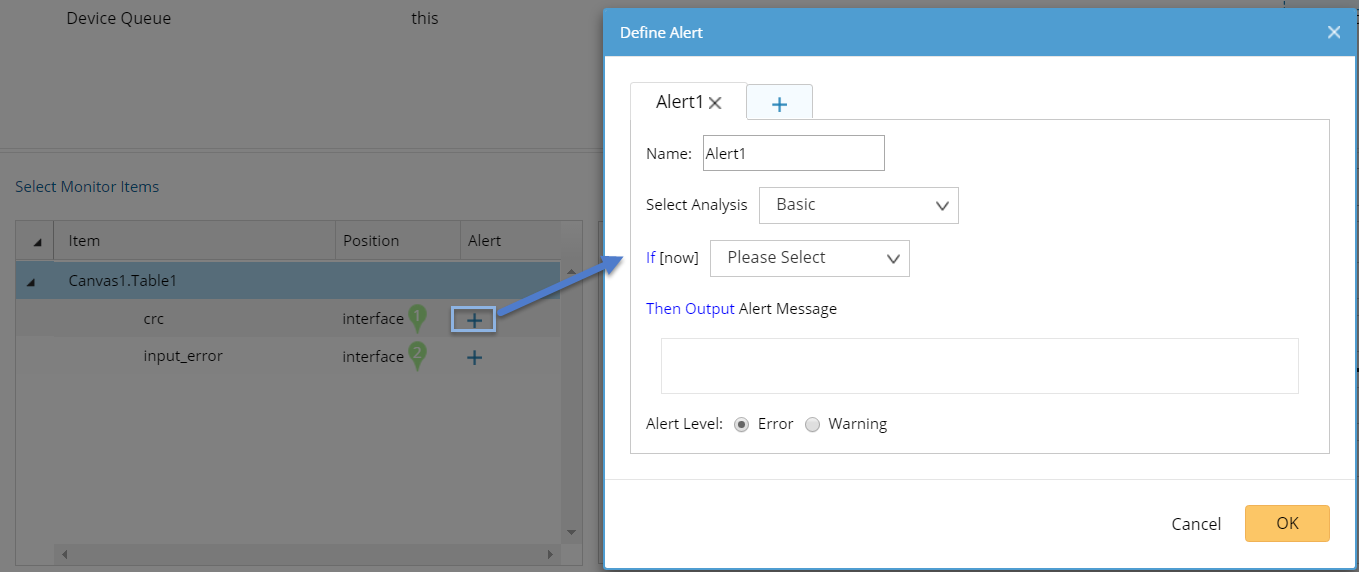
When a variable reaches the predefined conditions, the system highlights the variable and sending alert notifications in Event Console. Example: Define an alert condition for the variable $input_error (interface input error). 1)Click the 2)Select the analysis type to set conditions. The alert will be triggered as soon as the conditions are met.
3)Select the alert level. The difference between the two levels is only in the color and text display. |
|---|
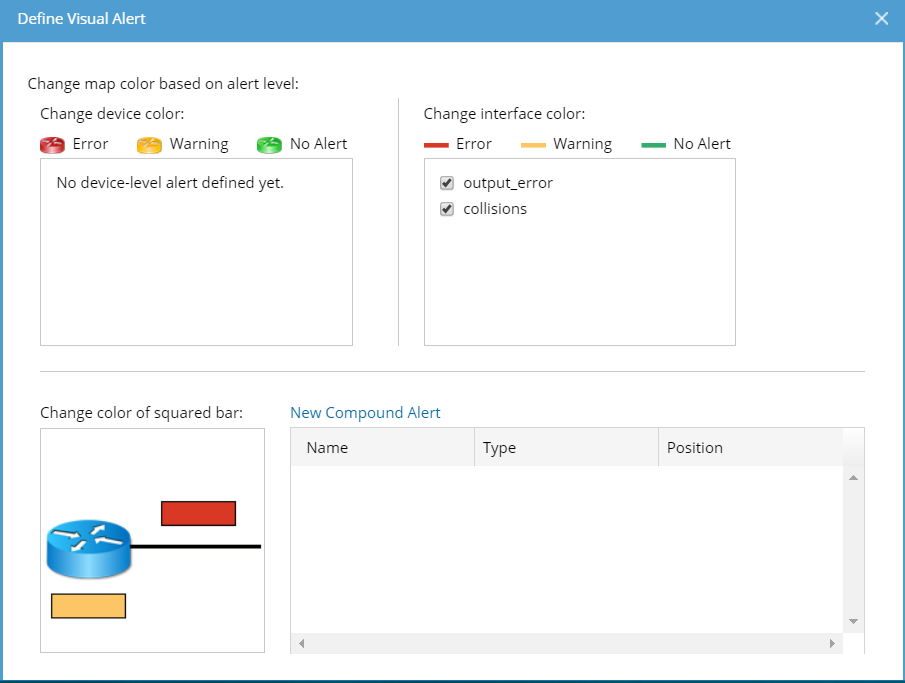
The visual alert refers to highlight devices or interfaces on the map when the specific alert of monitoring items triggers. 1)Click Define Visual Alert and the following dialog prompts. The monitor items defined with alerts in step 4 are listed here. 2)Specify which variable change will cause the device or interface color change. You can select multiple variables. 3)If you want to set complex conditions to involve multiple variables, you can click New Compound Alert to define Compound Alert. a)Specify the Compound Alert type between Device and Interface. b)Set conditions for variables. See Defining Alert for more details. c)Enter the alert messages and select the alert level. d)Click OK. 4)Repeat step 3) to add more Compound Alerts. 5)Click OK. 6)Select a position for compound alerts on a map. |
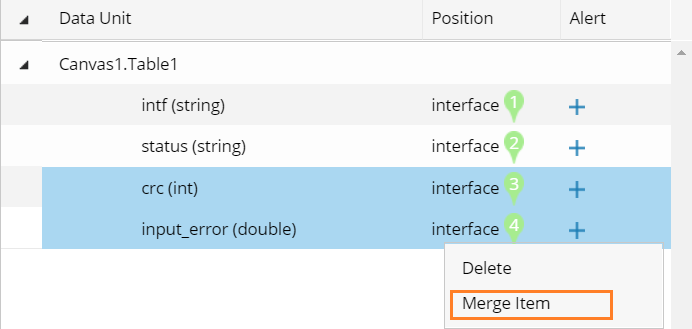
To utilize positions on the map more efficiently, you can merge monitor items within one category (device items or interface items). 1)Press the Shift or Ctrl key on your keyboard to select multiple monitor items and click the 2)Enter a new name for the newly merged items and click OK. 3)Select one position for the merged items. |
See also: