Generic Widgets

Contents
The following generic widgets are built-in widgets and can be used directly in a dashboard.
▪Map
Configlet by Config Parser
Configlet by Config Parser widget is designed to display device configlet parsed by a predefined parser based on its device type. For example, EIGRP configurations on a device and all related interfaces.

▪Select a parser from the Parser Library. By default, the full configuration file in the current baseline is displayed in the widget.
▪Select a parser variable from the Configlet list to parse the configuration file.
Configlet by Design Filter
Configlet by Design Filter widget is designed to display device configlet filtered by a predefined Design Filter. For example, display spanning tree configurations on a device and all related interfaces.

▪Select a data source. You can retrieve real-time device configlet from your live network or use history data. By default, the full configuration file in the current baseline is displayed for the selected device.
▪Select a design filter from the drop-down list to filter the configuration file.
Device Details
Device Details widget is designed to display device, interface, and module properties for a single device.

The displayed properties can be customized, including the built-in and system properties predefined in Global Data Repository (GDR). To show the properties customized in GDR, select Options > Show customized properties.
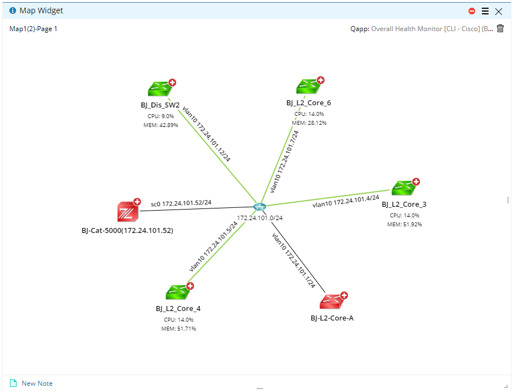
Map
On a map widget, click Load Map to select a map file and make selections between the two options:
▪Automatically create a map based on the selected devices in this dashboard — instantly map all devices in the device scope based on layer 3 topology.
▪Select an existing map page — click Browse to select an existing map file. If it contains multiple map pages, you can select a specific one.
Note: You cannot perform any operations in a map widget, except zoom controls. Click the ![]() icon and select Open Map in New tab for more operations.
icon and select Open Map in New tab for more operations.
Map widget can be bound with Qapp files. Data views will be generated and applied to the map automatically after Qapp execution.
Example:
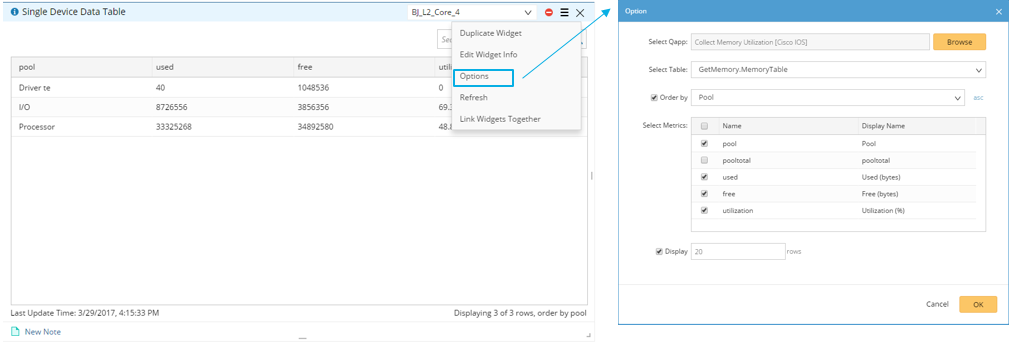
Single Device Data Table
Single Device View widget is designed to display device or interface metrics for a single device in one table.
Tip: The rows and column headers will switch if each metric is a single-value variable.
Example:
Multi-Device Data Table
Device List View widget is designed to display device or interface metrics for multiple devices in one table. With this widget, you can compare the metrics between different devices.
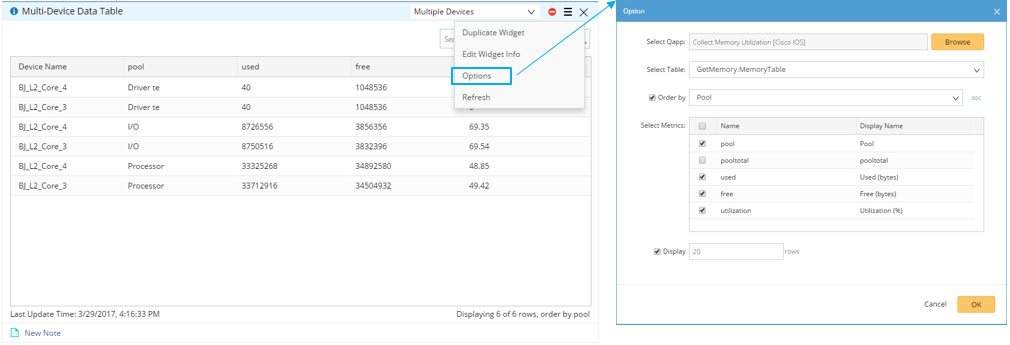
1.Click Options to open the widget configurations.
2.Customize the widget based on your needs.
1)Click Browse to select a Qapp file from Qapp Center. The default table and metrics used to order by the table are populated automatically.
2)Select the metrics to be displayed in the table.
3)Click OK.
Device Metric Chart
Device-level Metrics widget is designed to display the trend of single-value device metrics in a line chart for a single device, for example, the utilization trend of CPU and memory of a core device.
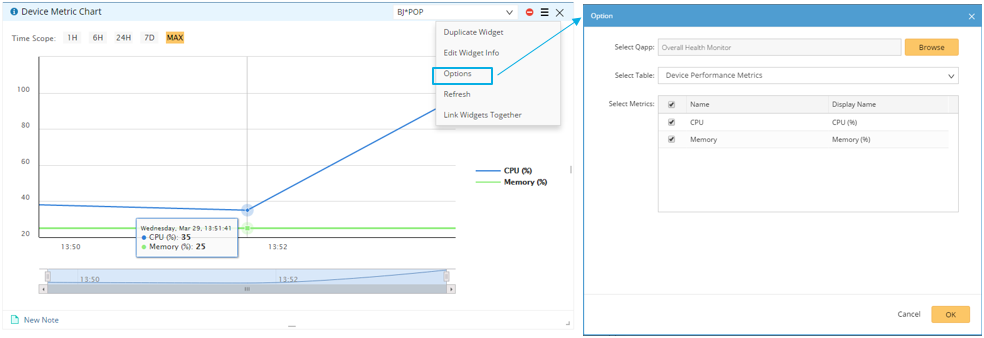
Tip: The widget can only display single-value metrics for one device. Besides, the values of these metrics must be a numerical type.
Interface Metric Chart
The Instance-level Metrics widget is designed to display the trend of interface metrics or multiple-value device metrics in a line chart for a single device, for example, the input or output traffic utilization trend of an interface.
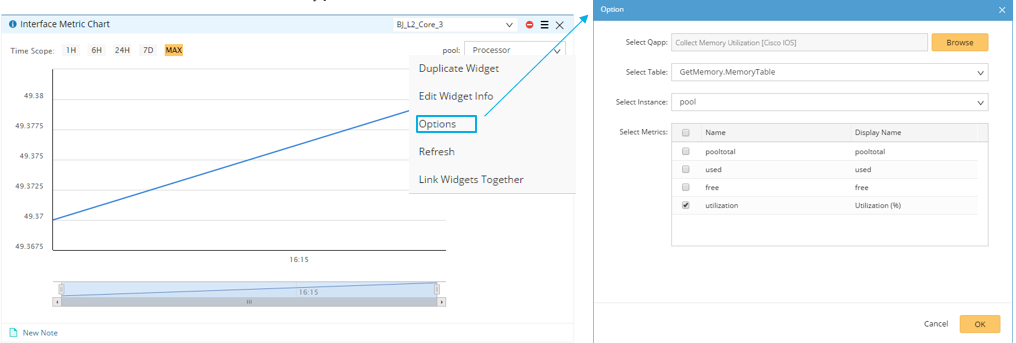
Tip: The widget displays multiple-value metrics for one device or a single-value metric of an interface. The values of the metrics must be a numerical type.
See also: