Monitoring Server and Service Metrics

Contents
Note: As an add-on component, the Service Monitor Agent must be installed on the servers that you want to monitor. See Installing Service Monitor Agent on Linux and Installing Service Monitor Agent on Windows for more details. If you deploy more than one system across multiple data centers, you will have more than one Service Monitor portal.
To monitor server and service metrics, complete the following steps:
1.In your web browser, navigate to http://<IP address of NetBrain Web API Server>/monitor.html#/login. For example, http://10.10.3.141/monitor.html#/login.
2.Enter the username and password (default: admin/admin), and click Log In.
3.On the Home Page, you can monitor key server metrics, server connectivity, resource utilization, service status and so on.
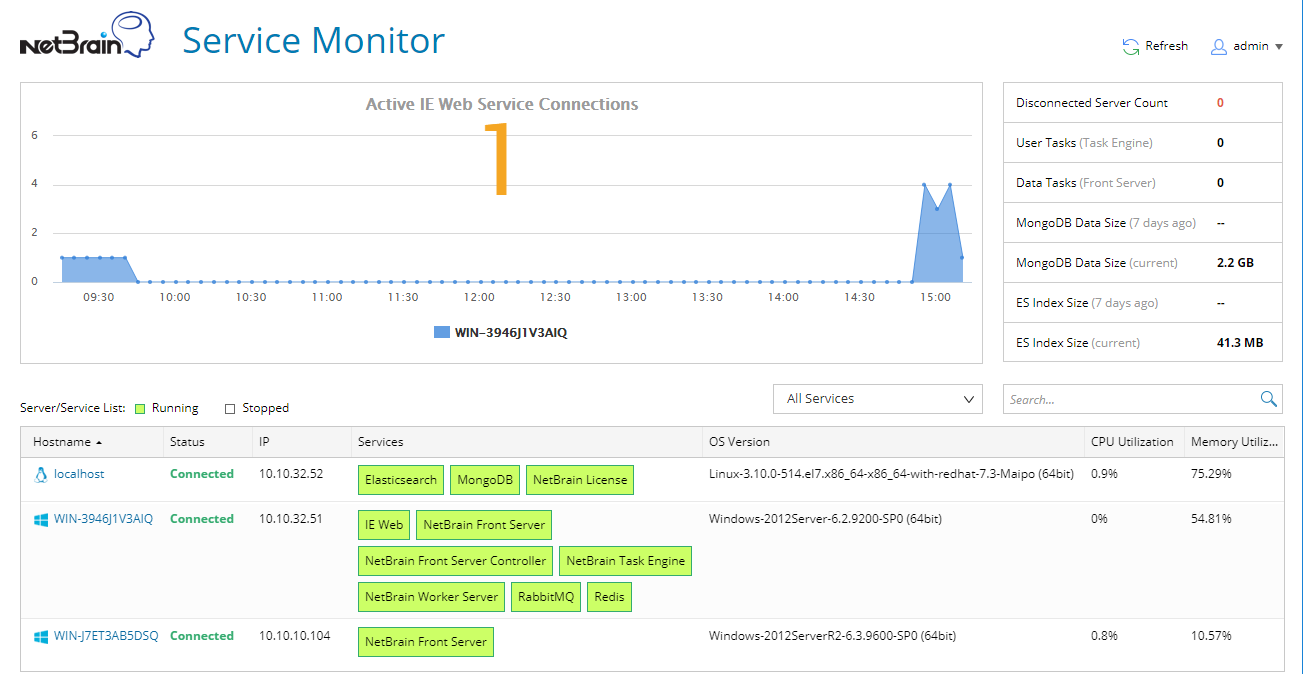
4.(Optional) Perform management operations on services.
Example: Start Front Server Controller service which is stopped unexpectedly.
1)In the Services column, point to the target NetBrain Front Server Controller service.
2)Click the  icon to restart the service.
5.To check detailed metrics for a specific service, click the service name to view details. See Service Metrics for more reference. By default, the system collects metric data every 5 minutes and refresh the page every 5 minutes to display the latest metric data.
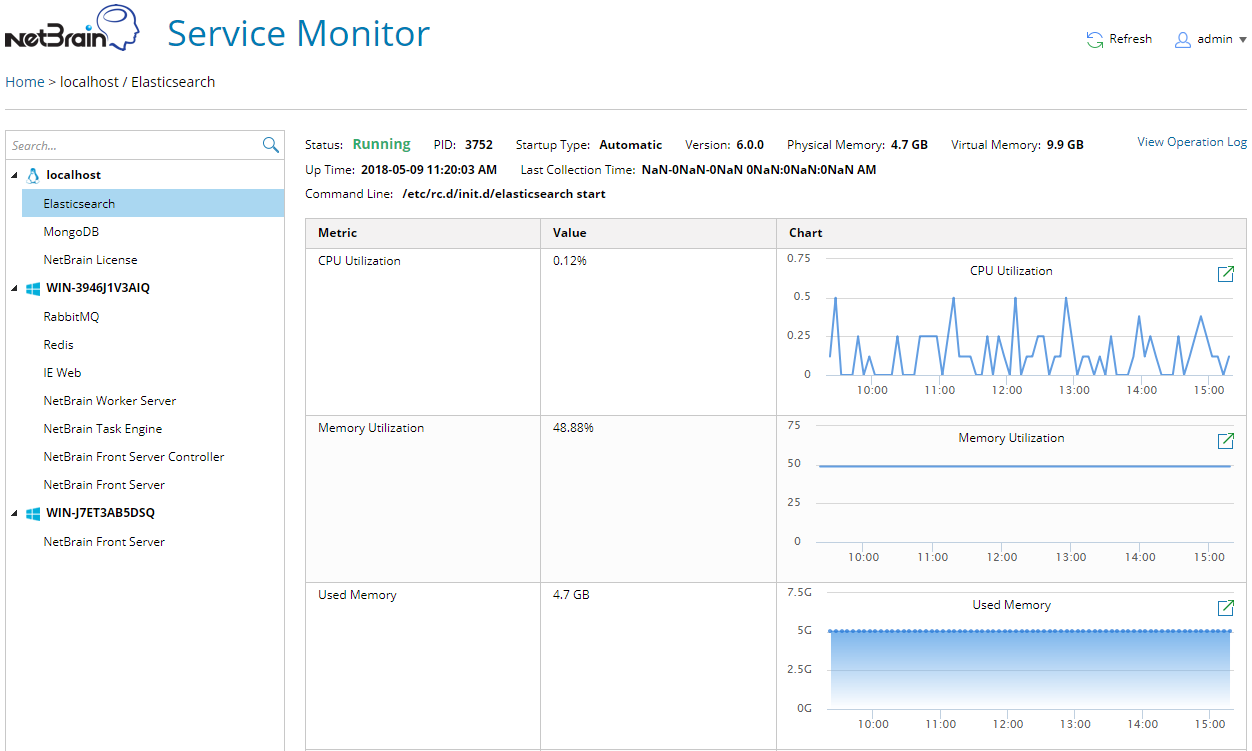
6.At the upper-right corner of the current page, click the View Operation Log link to view the operations executed on the service.
7.To export detailed logs from a server for troubleshooting, click admin > Support Log at the upper-right corner.
See also: