Saving and Running a Monitor Qapp

Contents
Saving a Qapp
1.Click the  icon at the upper-right corner of the Qapp Editor.
2.Re-name the Qapp, such as Monitor CPU Usage.
3.Save the Qapp to the target location. See Qapp Center for details on the target locations.
Running a Qapp
1.Map the target devices.
2.On the map page, right-click on the blank area and select Run Qapp from the drop-down menu.
3.Select the Qapp you have created, and click OK.
4.In the opened Runbook pane, set data source and threshold. In this case, select Pull live data regularly as the data source and set frequency as every 1 minute, which means that the system retrieves live data from devices and refresh the corresponding values every 1 minute. For the demo purpose, modify the default threshold value to 1.
5.Click Run in the Runbook pane. You can configure more settings such as data source, frequency, and threshold before running a Qapp. See running a Qapp for more details.

Data Chart
By default the system retrieves the data from the live network and displays the values of variables of the current poll cycle in the map. The data of the current cycle is also displayed in the left pane under the Qmap as a table format. Click Device Data or Interface Data tag to see the values of the device level or interface level variables correspondingly.
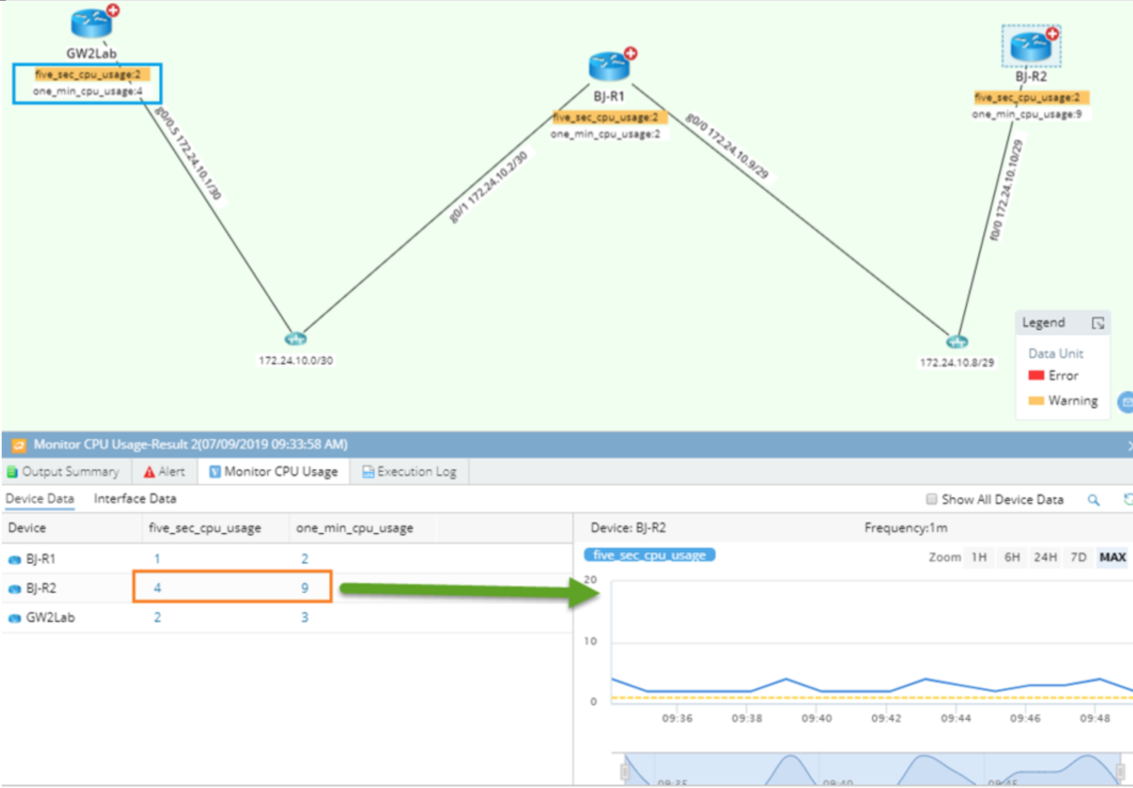
Select one value to see its historical chart in the right pane. The chart is meaningful for an integer or double variable, not for a string variable. The horizontal time scale can be adjusted by selecting 1 hour, 6 hours, 24 hours and 7 days.
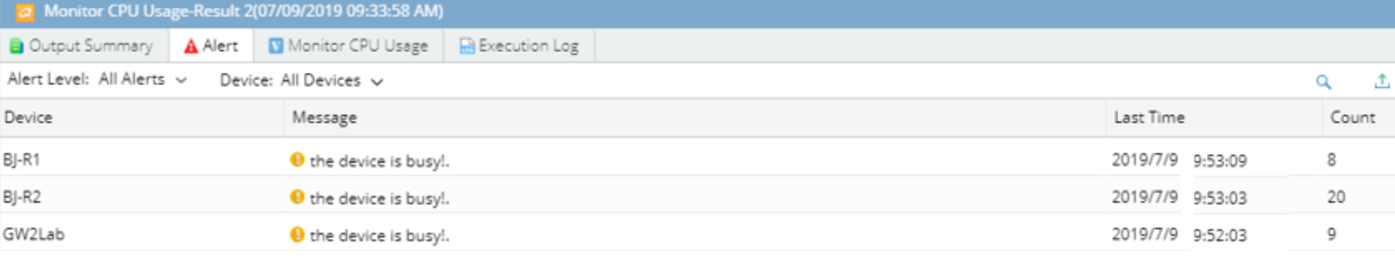
Click the Alert tab in the device data pane to view alerts created for each device. The count is the number of times this alert message has been created.