Using Dashboard to Visualize Multi-Dimensional Data

Contents
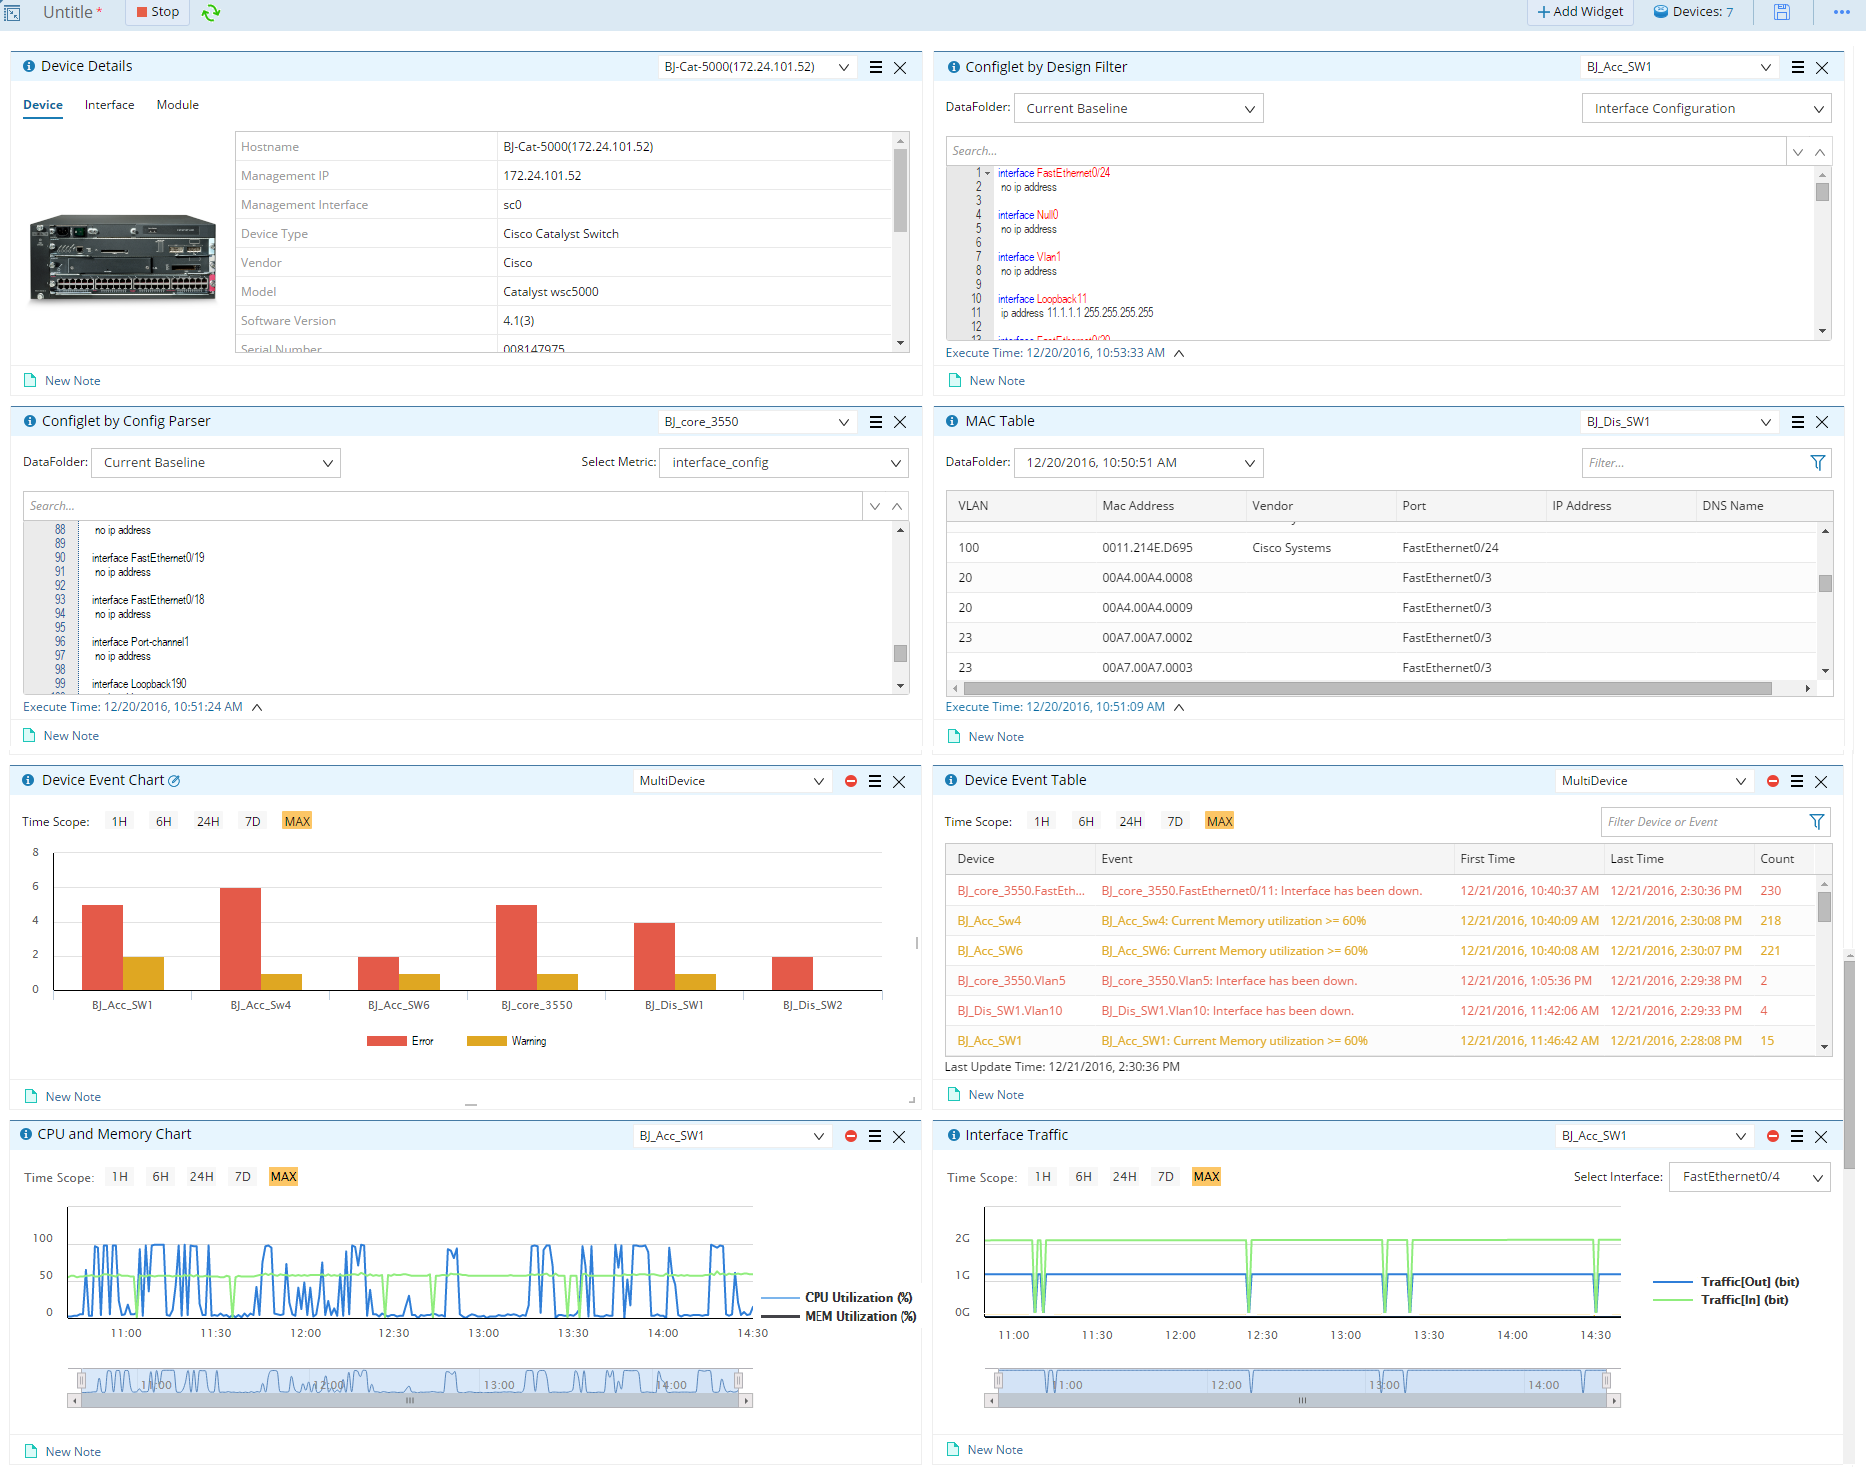
In some monitoring or troubleshooting scenarios, you may want to browse the configuration files, data tables, performance statistics, and other data synchronously at a glance. Dashboard organizes and displays multi-dimensional data for diversified scenarios on a single screen. Dashboard is highly customizable and interactive, integrating real-time data, tables, and charts.
This chapter covers the following topics:
▪Creating a Dashboard from a Map
▪Creating a Dashboard from Scratch
▪Dashboard Widget and Template
▪Creating a Dashboard Template
▪Customizing Favorite Dashboard Templates