View the Detail Pane for More Data
The left side of the Detail Pane lists all variables in the current dynamic data view. If the last value of a variable doesn't match Golden Baseline, a red dot will appear over its icon, and its data unit on the map will be in red. The right side of the Detail Pane shows the comparison between a data point and all historical data points. The Golden Baseline Analysis field shows the current analysis result targeting all data. Once there is an alert, “Alert Detected” will be shown. If the Golden Baseline Rule is manually changed, the system will re-analyze all historical data according to the new Golden Baseline to address the abnormality and refresh historical alert results.
Number-Type Variable:
The values are displayed in a chart, and red dots refer to off-normal items.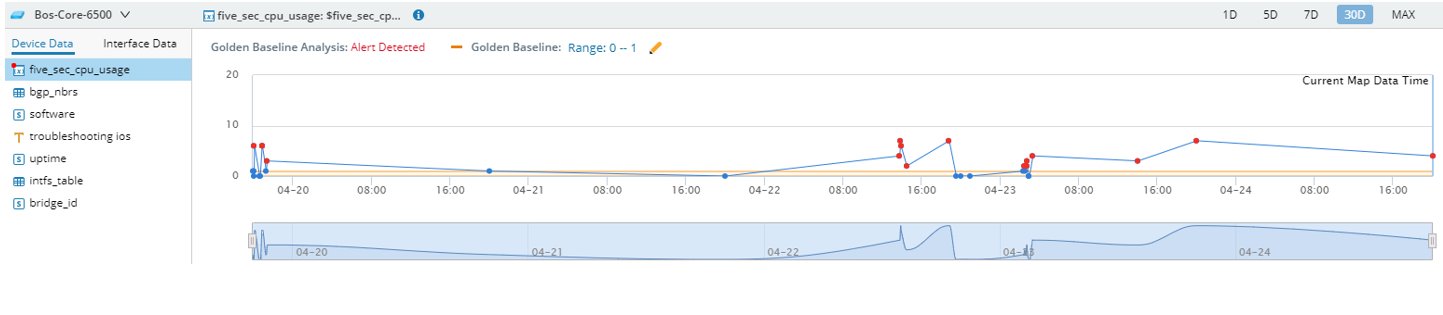
String-Type Variable:
The values are displayed in a table, and the off-normal item is highlighted in red.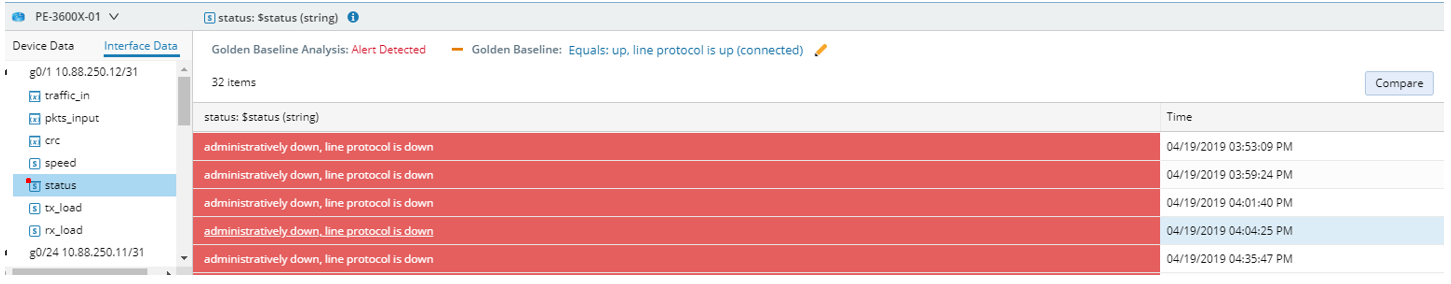
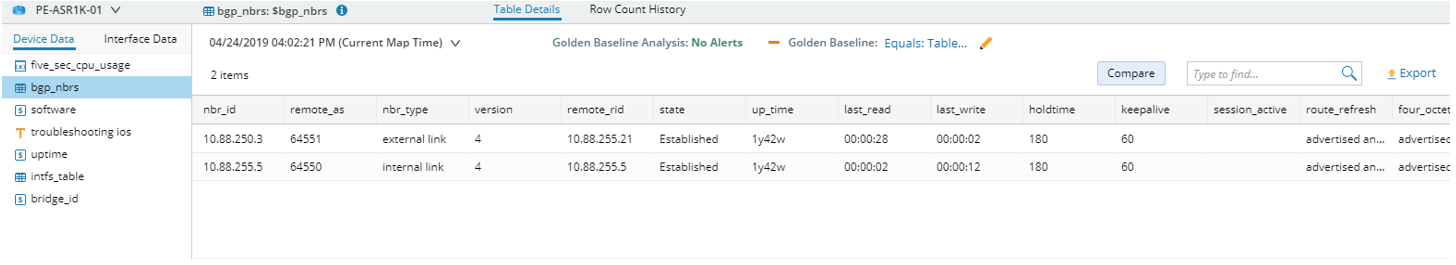
Table-Type Variable:
Only the current values are displayed. If there are any off-normals, alerts will be displayed in the Golden Baseline Analysis field.