R12 Publication-2025July16
Visualize the LogicMonitor Monitor Metrics History Result with DVT
Use Case
Using the publicly available LogicMonitor REST API, NetBrain has created an integration compatible with NetBrain that enables a NetBrain end user to easily access the LogicMonitor monitoring metrics history of the past 1 hour from a topology-based spatial troubleshooting context - a user-created map.
With this integration, NetBrain can overlay the following extended information in a table.
- Cisco Switch
- CPU
- Memory
- Host Status
- Cisco Router
- CPU
- Memory
- Host Status
- Check Point FW
- CPU
- Checkpoint System Global Statistics
- Host Status
- Extreme Switch
- Extreme Chassis Status
- Extreme Network Memory Usage
- Host Status
- F5
- CPU
- Memory
- System
- Host Status
- Interfaces
- Riverbed
- CPU
- Riverbed Global Status
- Host Status

|
Note: This solution makes queries to LogicMonitor based on the device hostname as the primary key. NetBrain device hostname and LogicMonitor hostname must be identical to make this solution functioning. |
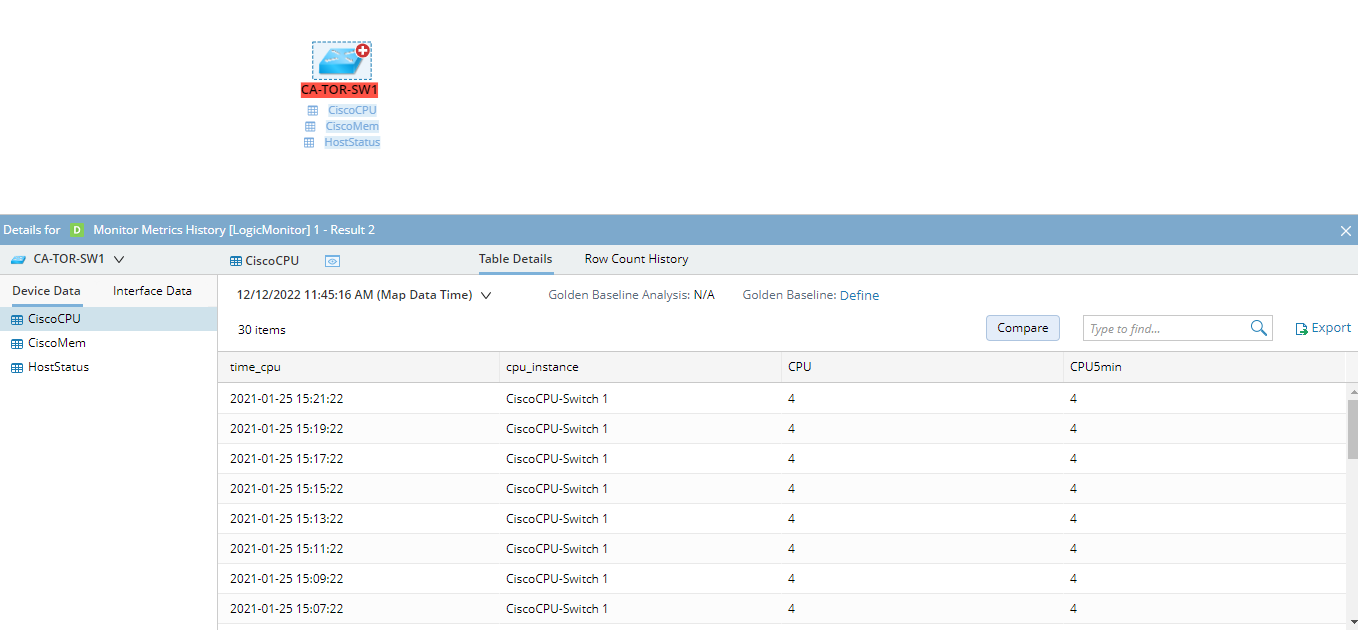
NetBrain Map with LogicMonitor Monitor Metrics History Overlay
Below are example representations of the LogicMonitor monitor metrics history data overlay on the NetBrain map.