Support Health Report aims to check the health status of NetBrain systems online/offline so that system improvements can be made promptly according to the report.
Users with the privilege of system management can access Support Health Report in Service Monitor.
- On the System Management page, click the start menu
 and select Service Monitor from the drop-down.
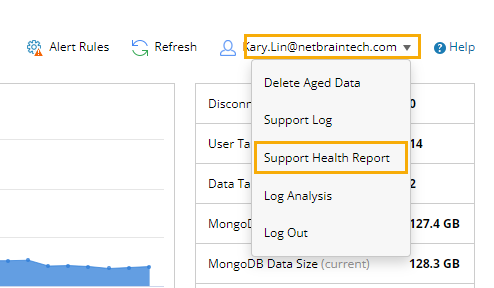
 - Click the user name.
- Select Support Health Report from the drop-down.
System Health Checklist
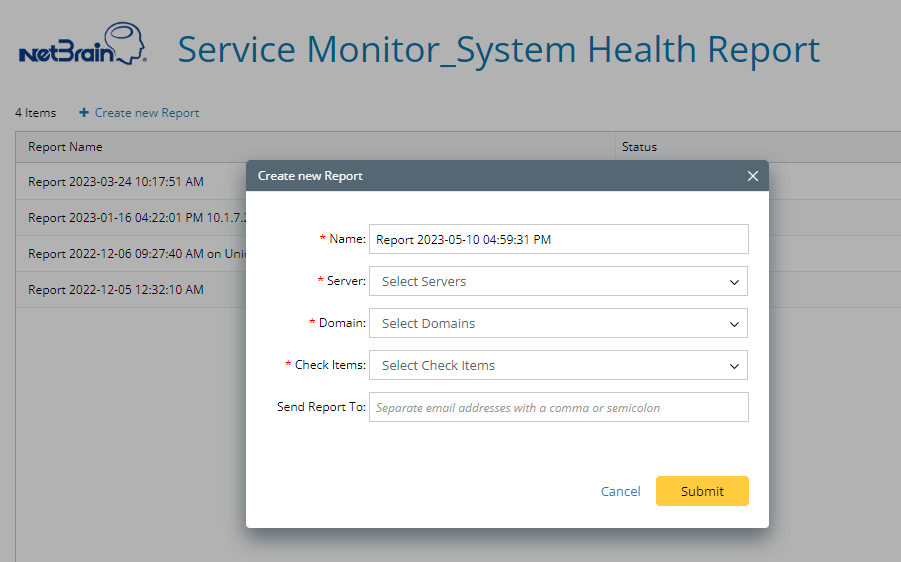
You can generate a report by customizing the following settings:
- Report Name
- Server to check
- Domain
- Items to check
Support Health Report can collect information in the following areas:
Number
| System Health List | Items |
| 1 | Product Summary |
- Basic information about the product
- Version number
- Patch number
- License info
… |
| 2 | Server Summary | Basic information about the server and the subcomponents installed on the current server, as well as the corresponding version number |
| 3 | Certificate Information | With information on the use of certificates by various components in the system, we can understand in advance the risks and impacts of certificate expiration. |
| 4 | Service Monitor connectivity | Understand the operational status of the Service Monitor Agent. |
| 5 | Server Information |
- Detect the basic information of the server and the historical metrics such as CPU/Memory to facilitate the retrospective of historical event.
- Analyze whether the third-party software (Python, Java, etc.) impacts the performance of NetBrain System.
- Exception Dump Information
- Windows Installed KB Updates (Windows Update Patches) information list
- IIS Application Pool Status
|
| 6 | Security | The following primarily detects whether the relevant permission settings are damaged since NetBrain system uses them during execution and upgrade.
- NetBrain Agent Service user privilege is used to troubleshoot problems resulting from insufficient permissions during the execution of Service Monitor Agent, such as Auto-update.
- Running VB Script is used to troubleshoot errors caused by the absence of VBScript run permission during the Auto-update.
- UserGroups Information is used to troubleshoot NetBrain system Web and Worker problems caused by insufficient permission on Windows Servers.
- Security Policy setting is used to troubleshoot NetBrain system Web and Worker problems caused by insufficient permission on Windows Servers.
|
| 7 | Sub Process Check | Monitor the status of various components’ child processes in NetBrain to determine system health more precisely. |
| 8 | Metrics | Identify the detailed status of each NetBrain component by checking the metrics. |
9
| Server Firewall & Port Information | Check if the firewall of each server is turned on and if the port of each component is open.
- Whether the firewall is enabled
- Whether the incoming ports of MongoDB, Elasticsearch, RabbitMQ, and Redis are open
- Whether the outgoing port of the Front Server and the incoming port of the Front Server Controller are open
- Whether the outgoing ports of SMTP and IMAP are open
|
10
| External Network connectivity | Check the network connectivity required for specific needs:
- Whether the email-sending port is connected
- Whether Teams can be connected to the Internet
- Whether ShareFile can be connected to the Internet
|
11
| Multi-DC Configuration |
- Whether Multi-DC is implemented
- Whether Multi-DC is configured properly
|
12
| Auto Data Clean Check |
- List the time when the data clean was last executed. Users can determine if the data clean works properly from it.
- List the data clean status of each data type, i.e., whether it’s enabled
- List the clean rule for each data type, i.e., when the old data should be deleted
|
13
| Email Notification Setting |
- Check if the System Email Setting has been enabled and defined.
- Check if the Service Monitor Alert Setting has been defined. The email receiver and the alert rule must be defined.
- Provide the frequency of sending email.
- Check the SMPT server.
- Check the sender email address
|
14
| Auto-update Information |
- Check if the auto-update has been enabled.
- Check the last result for auto-update
|
15
| MongoDB |
- MongoDB Metrics
- Check the status of the replica set
- Check the status and role(master/secondary/arbiter) of each node
- The number of currently open files
- If the MajorityReadConcern has been enabled for the MongoDB cluster
- MongoDB Data Size Check: The data size in each domain
- MongoDB Slow Queries: Slow queries and their correlated metrics
|
16
| RabbitMQ |
- RabbitMQ Metrics:
- Check the status of the RabbitMQ cluster
- RabbitMQ Queue Check: Check if there is an abnormal queue in RabbitMQ, and if consumers exist
|
17
| Redis (Master Redis/Slave Redis/Sentinel Redis)
| - Redis Metrics/Redis Sentinel Metrics:
- Check the status of the redis cluster
- Check the status and role (master/slave/sentinel) of each node
- Check the status of service, etc.
|