Diagnosis Tab
On the Diagnosis tab, you can query alerts from preventive automation, view NI results, and manually run the diagnosis. The Diagnosis pane opens as follows: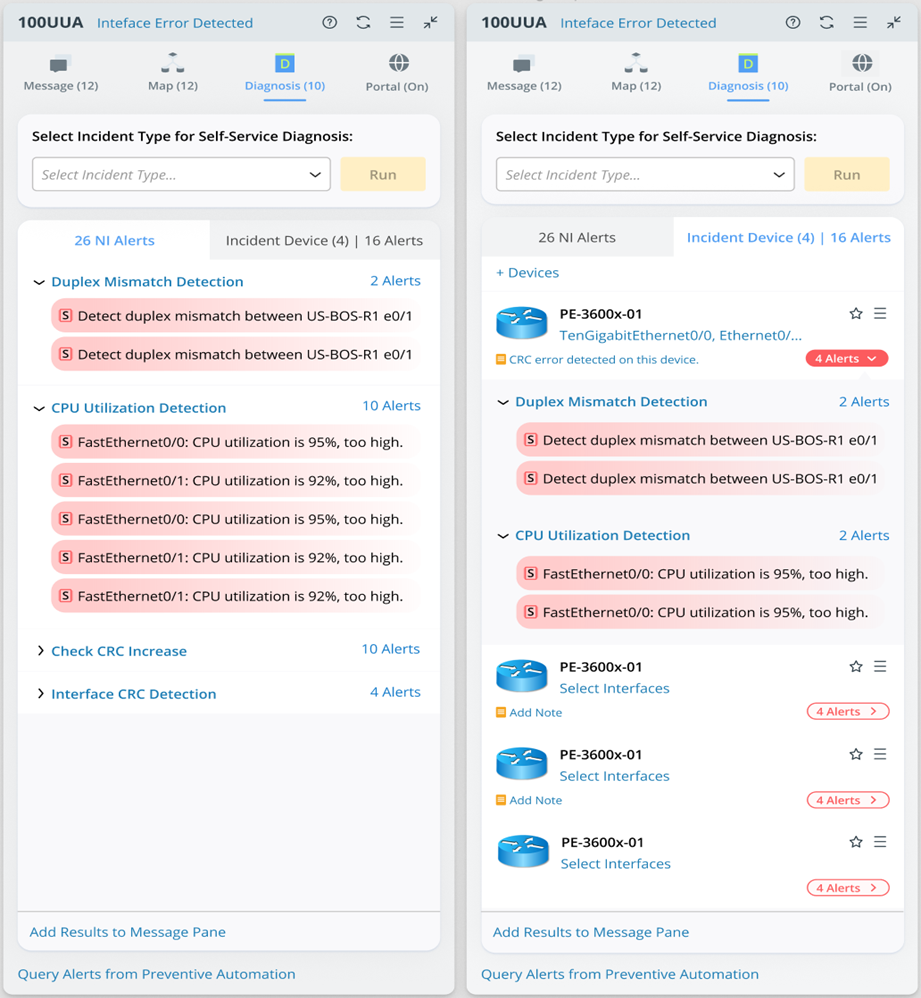
You can run self-service Diagnoses defined in TAF in a web incident by selecting an incident type. 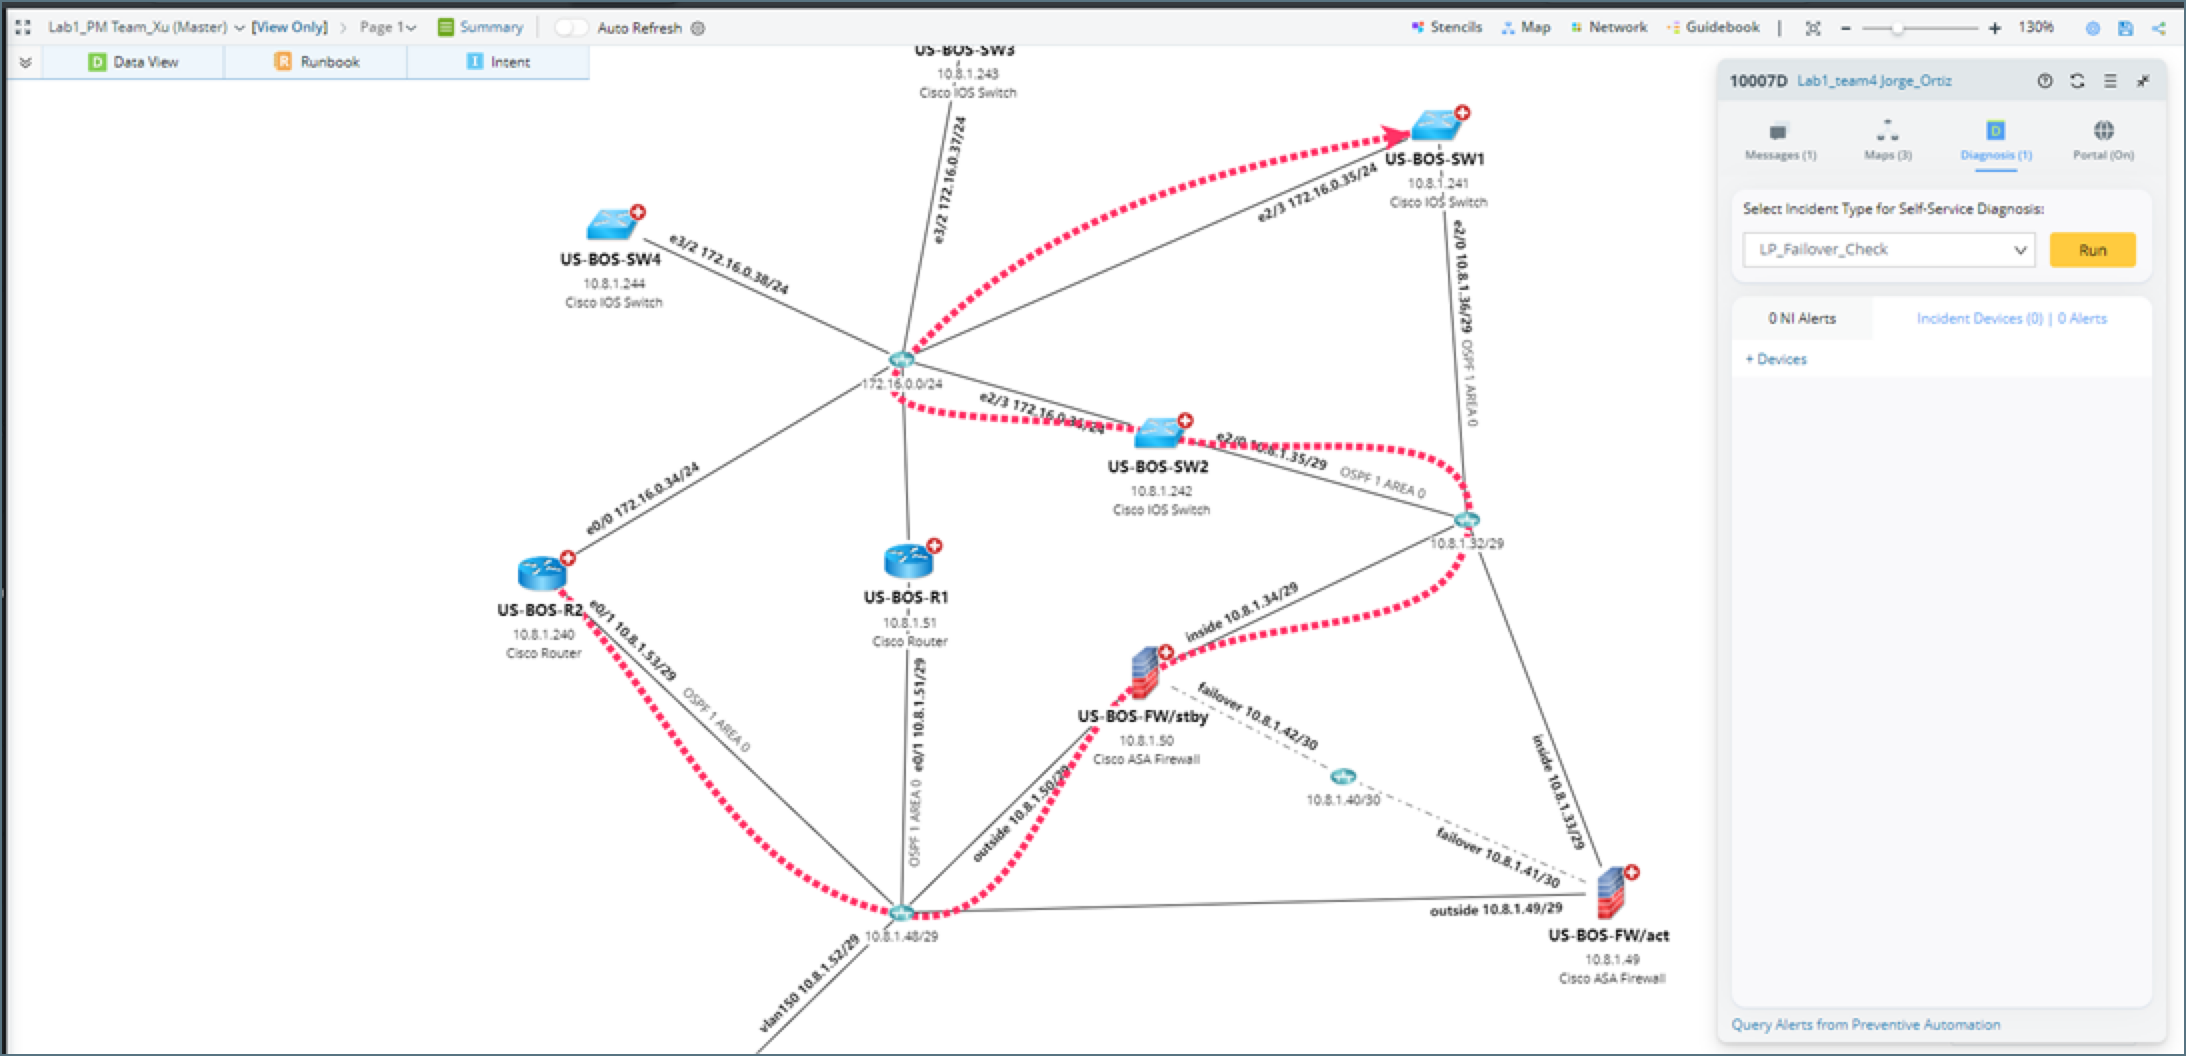
After the NI/NIC in Diagnosis is executed, the execution results will be manually sent to the incident message tab (click Add Results to Message Pane) and the output of the diagnosis pane.
- Select an incident type from the drop-down list under Select Incident Type for Self-Service Diagnosis.
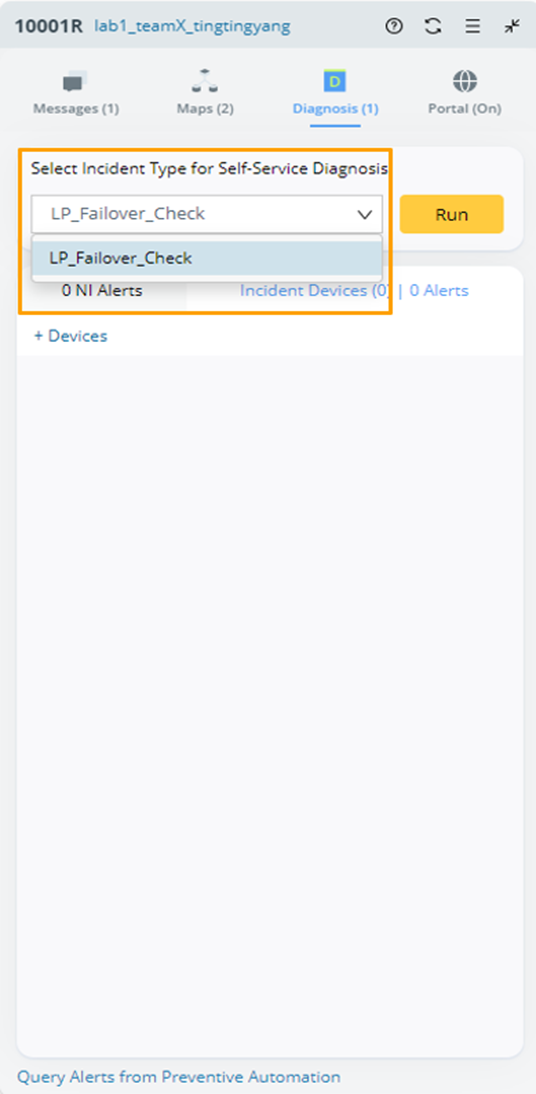
- Click Run.
- In the pop-up dialog box, select a device associated with the selected incident type, then click OK.

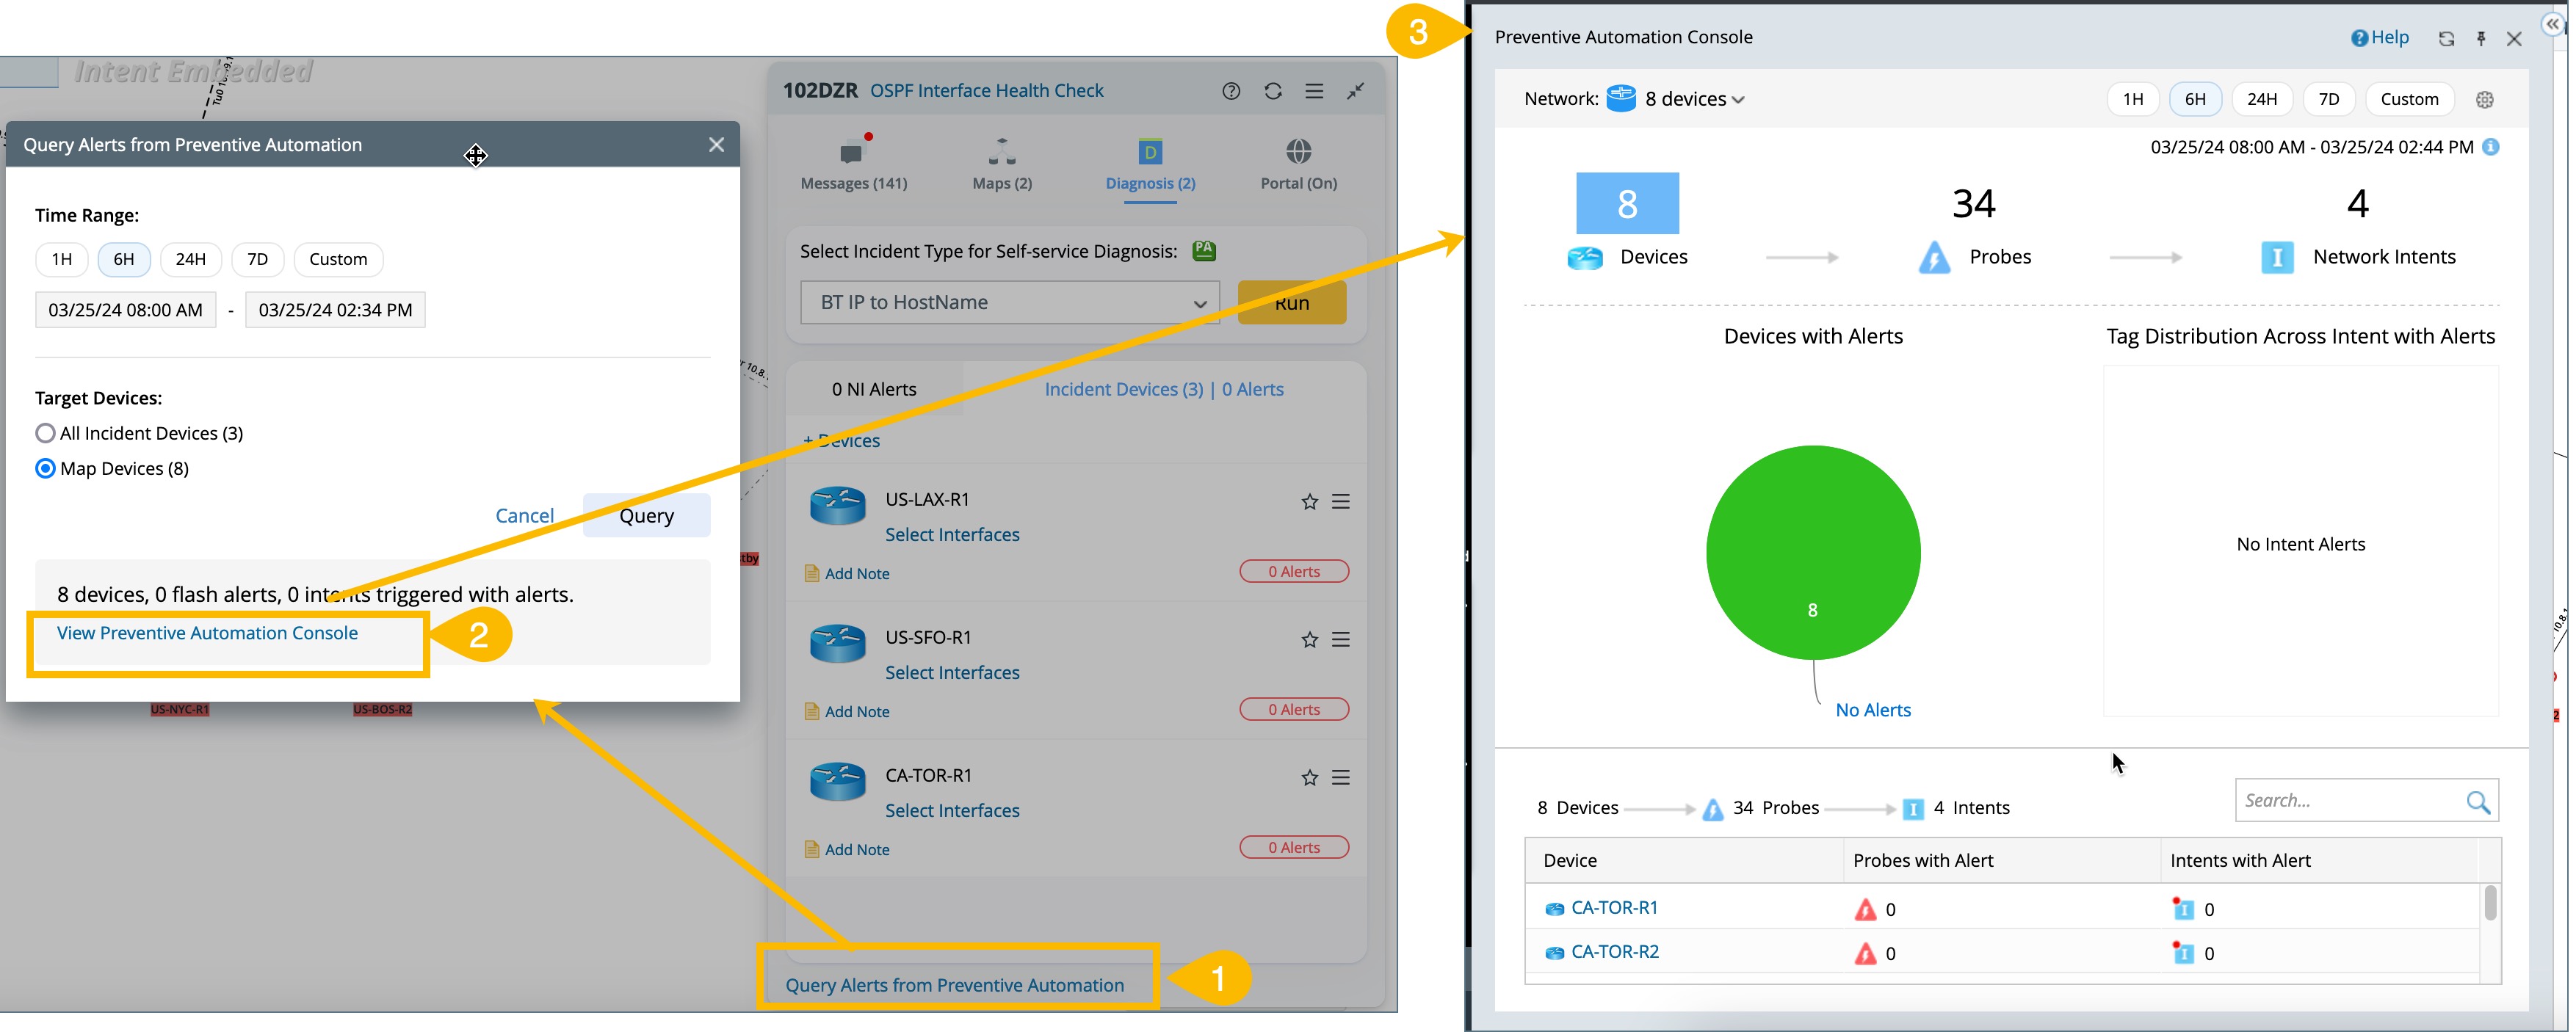
Query Alerts from Preventive Automation
You can query all alerts for incident devices or current map devices. A query summary is displayed in the Query Alerts from Preventive Automation window from Incident Message pane. And the query summary has a link to View Preventive Automation Console.
After the NI/NIC in Diagnosis is executed, the execution results will be sent to the incident message in the diagnosis pane.
You can select the NIs to view NI-level and device-level alerts generated on the incident device(s). However, you can click the number to see more.
The execution results are not automatically published to the Message pane. However, you can manually publish results to the Message pane, controlling the alert messages displayed.

|
Note: Self-Service Diagnosis result records will not be reserved. Only the last execution result is visible. |
Incident Device
Under the Diagnosis tab, you can add relevant devices to the collaboration session to inform all members about the suspicious devices and interfaces or those involved in the troubleshooting. Each added device/interface can be annotated to share insights with members.