R12 Publication-2025July16
Run the Created Intent
After an intent is created via intent replication, the Run & Save intent pane will automatically unfold to the right, where intent details are displayed. Click Run to run the intent, then you can go through the execution results in this pane. The Run settings can be configured by clicking the Live Data option next to the Run button.

 |
Tip: If the created intent has been executed several times, select a history record (click the  icon, then the history record list will pull down) to view the corresponding execution outputs. icon, then the history record list will pull down) to view the corresponding execution outputs. 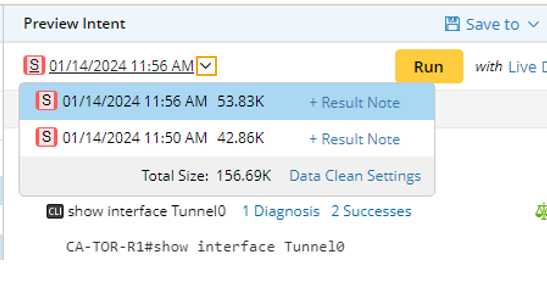 |
Intent Execution Settings in Auto Intent
The following intent execution settings in Auto Intent can be customized.
Data Source Settings:
- Live Data: The system will retrieve live data and use the retrieved data for intent execution.
- Use Active Cache: This option can be selected only after you select Live Data as the source for intent execution. All live retrieved data is added/updated into a global Active Cache for future live data requests. With this function enabled, live data retrieval from devices occurs only when cache data is unavailable or outdated. This function aims to safeguard network devices against excessive Telnet/SSH requests.
- Current Baseline: The current baseline data will be directly used as data source for intent execution.
- ADT Dataset: ADT dataset is cached CLI/Configure data organized by ADT. Intent execution via auto intent could source from the historical ADT dataset data.
- Intent Baseline: Use the intent baseline defined in Intent for intent execution. This is mostly used for debugging.
Advanced Settings:
- Save diagnosis details: Define the conditions for saving intent diagnosis.
- Follow-up intents' execution: Set the scope of follow-up intents to be executed.
- Execution Log: Customize what type of log will be generated.
- Brief Log Mode (default): If this mode is selected, only major execution process logs are generated, and log for intent replication are not generated. In this mode, the amount of created logs is reduced.
- Debug Mode: All debug logs (including intent replication logs) are generated. In this mode, all detailed logs are shown for butter troubleshooting.
The intent execution results can be viewed in the post-execution Diagnosis Tree or the Map.
- Click the
 icon (Diagnosis Tree) in the Preview Intent pane to view results in the post-execution Diagnosis Tree.
- After running is finished, the results will be automatically applied to the current map. You can display the results in the map or remove results in the map by clicking the
 (Show in Map) icon in the second pane.
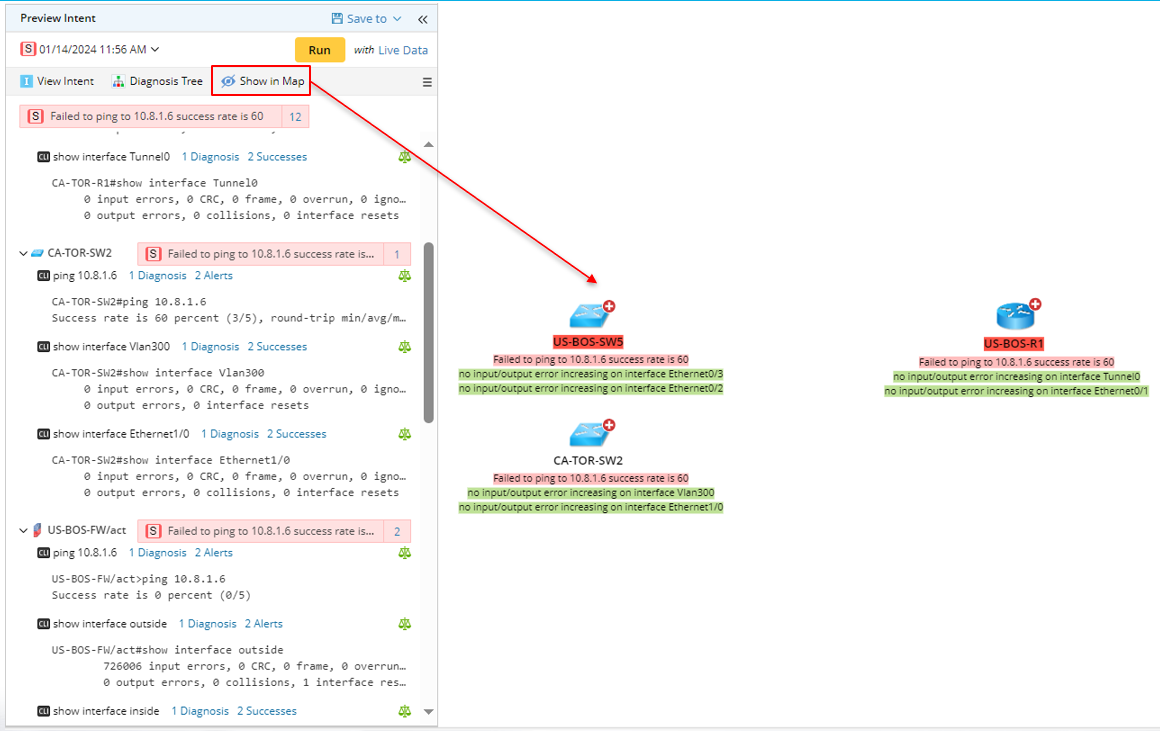
- View Execution Log: After running intent, you can view the execution log.

- From the drop-down menu of the second pane, click View Execution Log.
- In the Execution Log window, select the intent, devices associated with the intent or the CLI command of the device in the left pane to view the corresponding execution log.