R12.1 Project Publication-2025Dec23
View Triggered Automation Dashboard
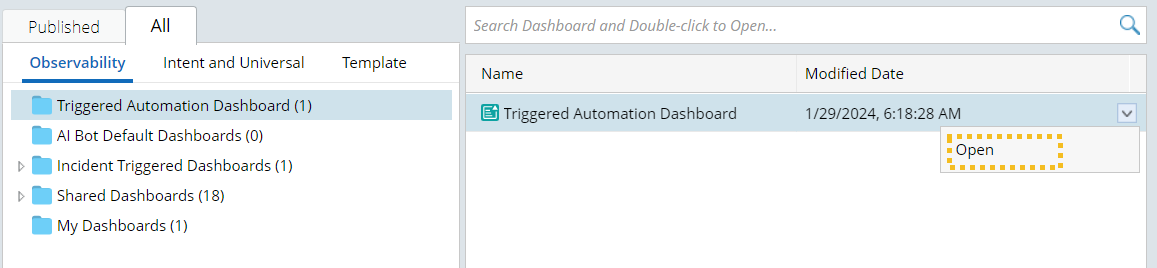
Open Triggered Automation Dashboard
-
Click Observability Dashboard> All> the Observability Tab> Triggered Automation Dashboard folder.

Note: The Triggered Automation Dashboard folder is a built-in folder. Users can only open it and are unable to perform any other operations. -
Right-click Triggered Automation Dashboard and select Open.
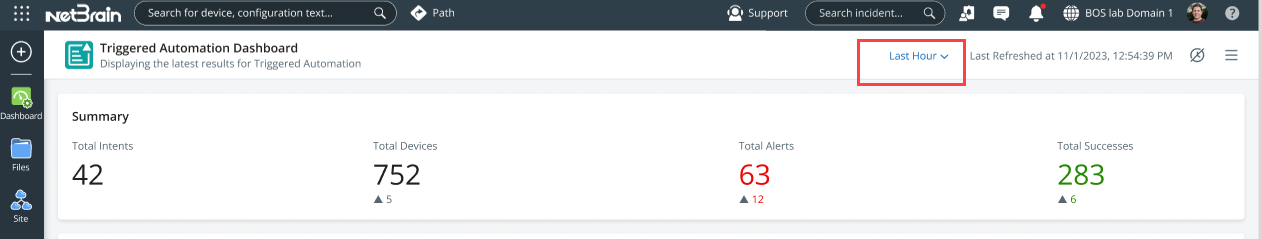
View Triggered Automation Dashboard
- Summary Chart.
-
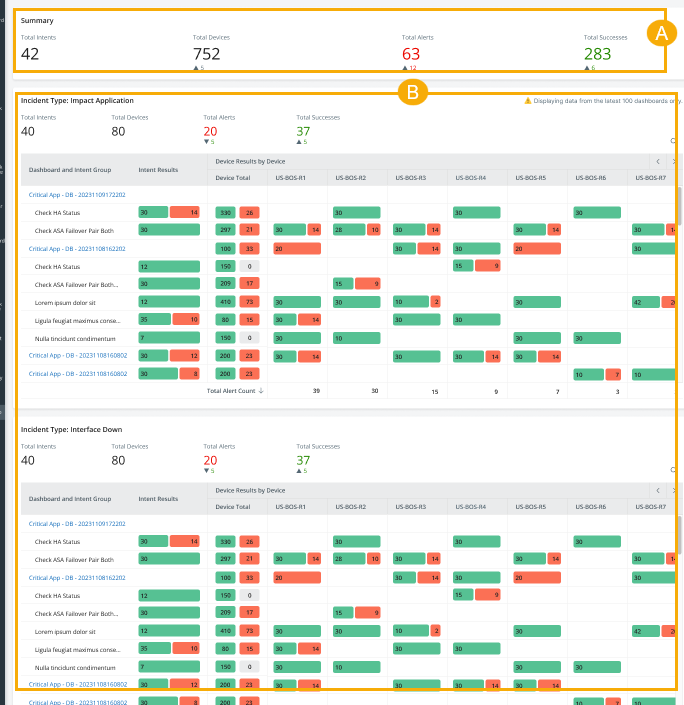
The intent dashboards with the same Incident Type will be grouped into one chart. Each chart will display both device results and intent results.
- The charts will be arranged in alphabetical order. (A-Z)
- The intent dashboards within the chart will be arranged in chronological order.
-
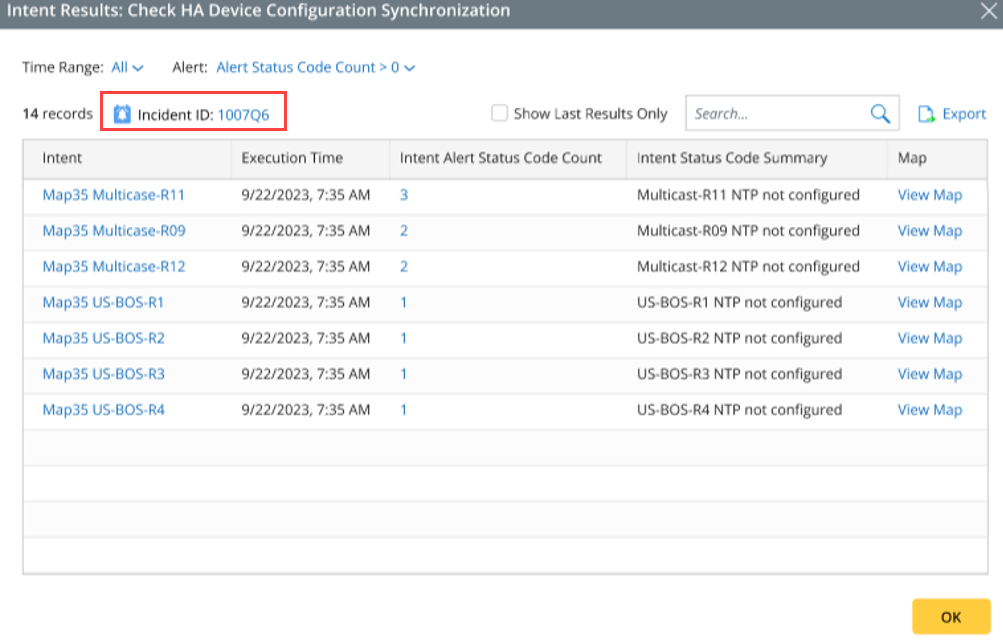
You can click a green or red bar to open its drill-down report. The link for the incident is included in the drill-down report.
Note: Each chart can display a maximum of 100 dashboards.
You can view triggered automation results at different time ranges.