View Customized Data Unit in Probe Data View
Selecting any Flash Probe or Monitoring Variable in Probe Data View Pane will enable the respective Probe Data View on the map (with the respective data unit reflecting the selected Flash Probe and Monitoring Variable). If multiple Flash Probes and Monitor variables are selected for the same device or the same interface, these data will appear accordingly under the respective device or interface folder.
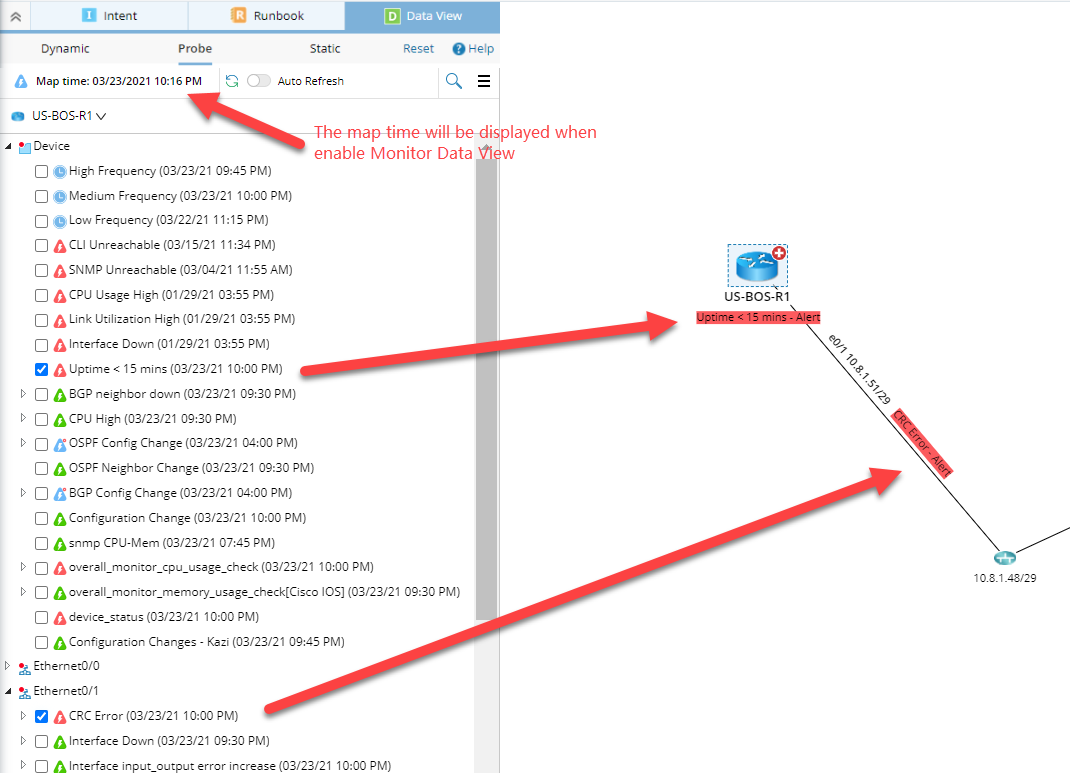
In Monitoring Data View, the map time can be used to control the displayed results of the Flash Probe or Monitoring Variable. Only the results that occur close to the map time will be displayed.
For example, the device “R1” and “R2” have Flash Probe “uptime < 15 mins” executed at different time points. If the map time is 11:20 AM 1/21/2021, the result of “uptime < 15 mins of R1 and R2” to be displayed is highlighted in the table below:
| Device Name | Execution Time |
| R1 | Generated Alert at 11:00 AM 1/21/2021 Generated Alert at 11:30 AM 1/21/2021 Didn’t Generate Alert at 12:00 AM 1/21/2021 |
| R2 | Didn’t Generate Alert at 10:55 AM 1/21/2021 Generated Alert at 11:15 AM 1/21/2021 Generated Alert at 11:45 AM 1/21/2021 |
The results of Flash Probe and Monitoring Variable can be distinguished by their unique formats/visual effects:
| Sample Results | Explanation |
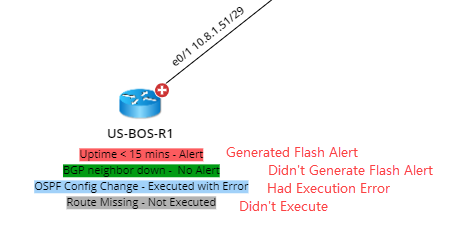 | The Flash Probe follows the format <Flash Probe Display Name> - <Result> and employs respective color codes to distinguish different result types. For example, BGP neighbor down – Alert means the Flash Probe “BGP neighbor down” generated alert. |
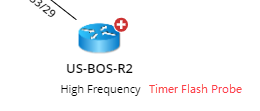 | The Timer Flash Probe follows the format <Flash Probe Display Name>. |
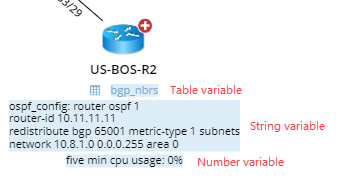 | The Monitoring Variable follows the format <Monitor Variable Display Name> : <Variable Value> <Unit> to demonstrate the value of String/Number and the format <Monitor Variable Display Name> to demonstrate the Table type variables. |
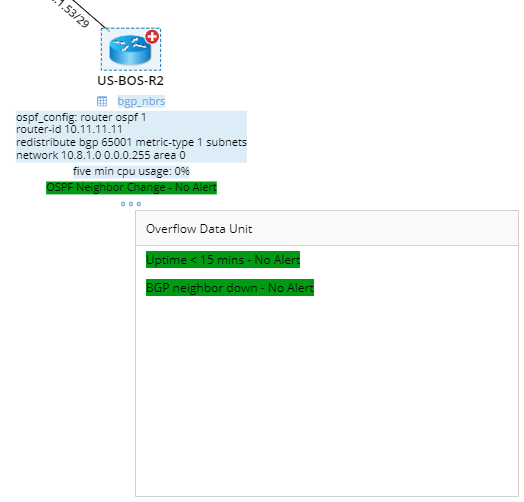 | Identical to Dynamic Data View, the device position can be displayed up to 8 data units (4 data units will be displayed on the map directly, and the remaining 4 data units will be displayed in the Overflow Data Unit window). The interface position can be displayed up to 16 data units (8 data units will be displayed on the map directly, and the remaining 8 data units will be displayed in the Overflow Data Unit window). |