Use Map as a Single Pane of Glass
One element that makes NetBrain maps dynamic is the rich level of detail available for each device. Every icon on the map represents an object with potentially hundreds of associated attributes. As you zoom in, additional data may become visible, appearing beneath the device icons and along the links, providing a deeper, contextual view of your network.
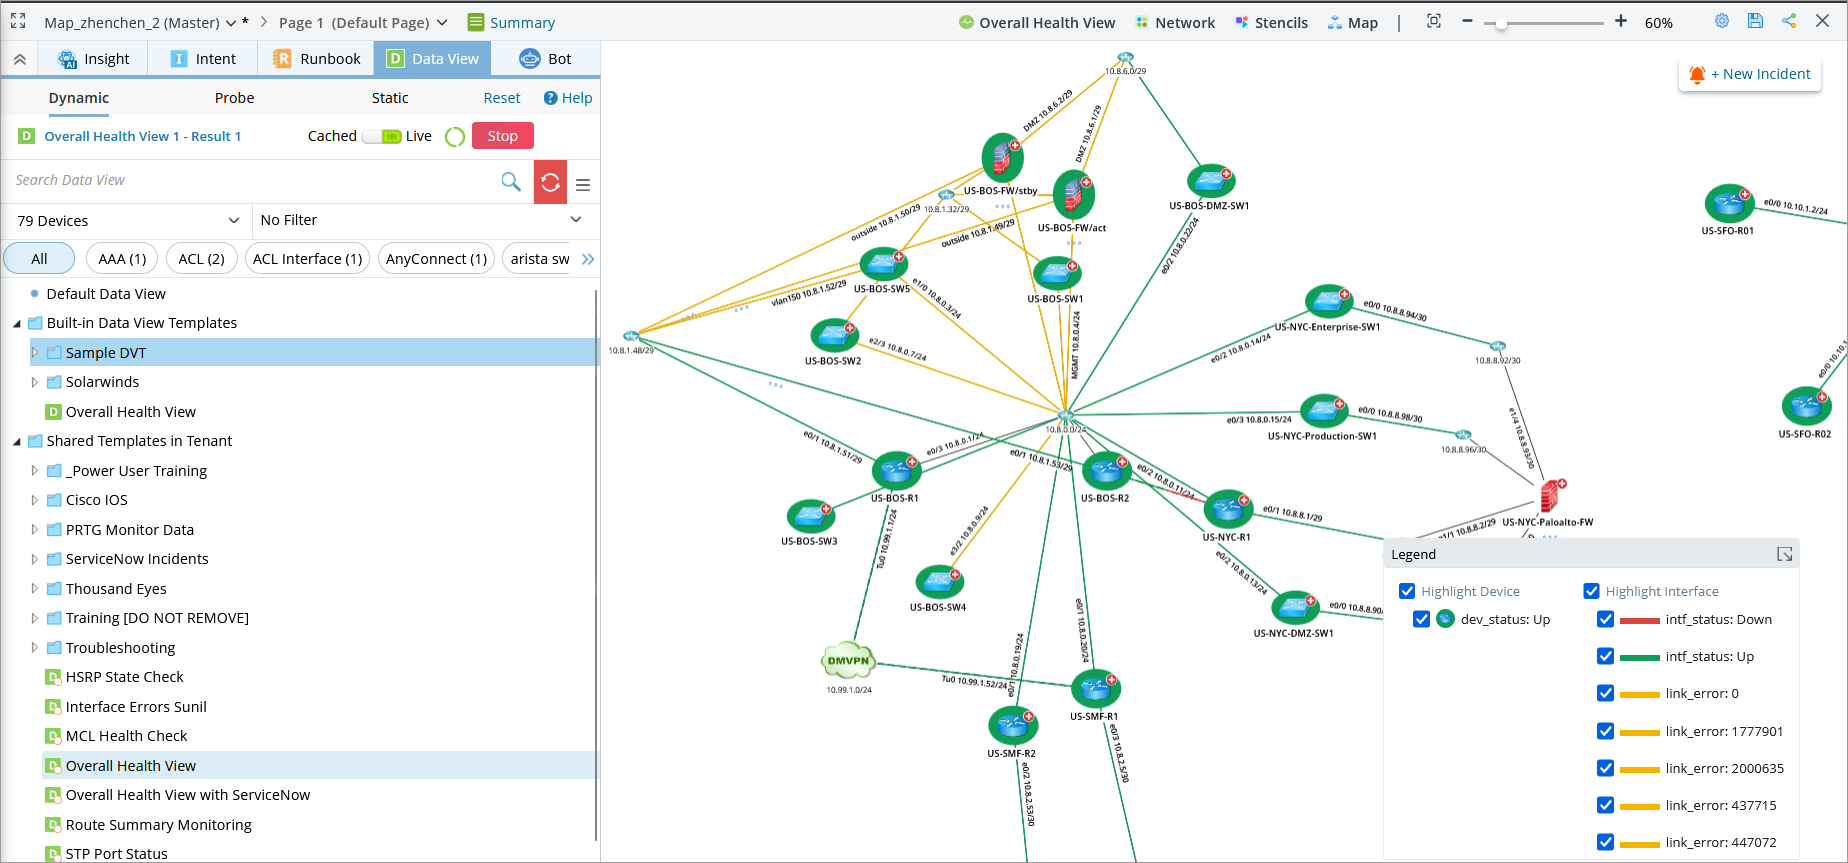
Beyond the built-in default data, you can visualize any network information using Dynamic Data Views (DVTs). A DVT is a customizable container that displays selected data directly on the map. It allows you to scale diagnostics across a device, a full map, or an entire Site, which makes DVTs a powerful tool for network engineers who need to monitor, investigate, and troubleshoot at scale.
With access to a Data View Template (DVT), you can perform the following tasks as examples:
-
Highlight all routing protocols on the network map.
-
Create alerts when BGP is not configured.
-
Overlay QoS policies for each device.
-
Drill down to individual interfaces.
-
View traffic patterns and identify where specific traffic is being matched.
One frequently used built-in DVT is General Health Monitoring. It shows key performance data for a device, including:
-
CPU usage
-
Memory utilization
-
Link bandwidth usage
Besides the data from the live network, DVT can be configured to retrieve data from your third-party IT tools via API, which enables you to pull all relevant data onto a Dynamic Map, minimizing the need to log into multiple tools to find the right information. In this sense, NetBrain turns its Dynamic Map into a Single Pane of Glass (SPOG), acting as the primary user interface for accessing any data from the network or any 3rd party tool.

Each DVT can use the Golden Baseline as a reference to monitor the health of various network data points. The Golden Baseline represents what is considered a normal value and can be either auto-calculated from historical data or manually defined based on your standards. By comparing live network data to this baseline, DVTs help you quickly identify anomalies or deviations in network behavior.
When differences are detected, you will see both the current value and the historical data for that specific variable. This makes it easier to understand trends and pinpoint the root cause of issues. The Golden Baseline ensures that you are always aware of any deviation from healthy or nominal conditions. Over time, it is a good practice to add more data variables to the Golden Baseline, especially after troubleshooting, so you continue improving your visibility and responsiveness to potential issues.

See Also: