R12.1 Project Publication-2025Dec23
Overall Health View
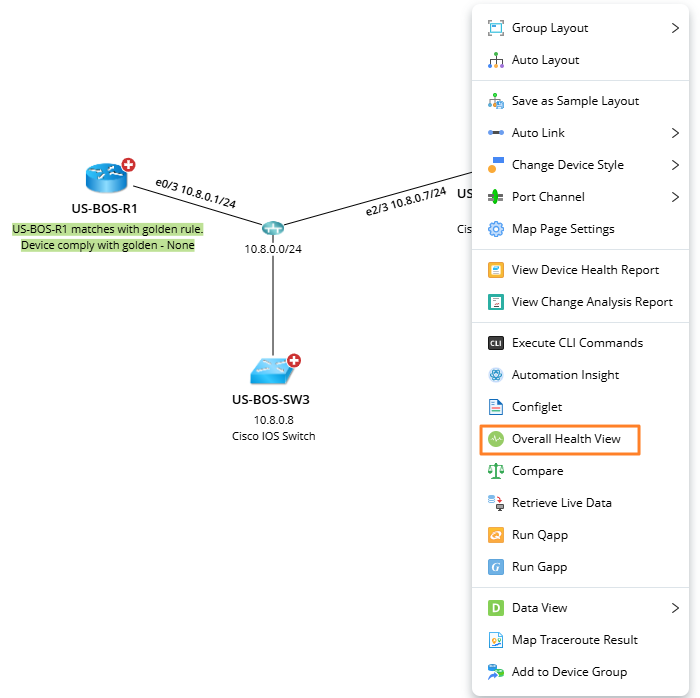
The Overall Health View action allows you to collect key performance metrics (such as CPU/MEM usage, and interface traffic) via SNMP or API from core devices.
-
Add the action node in any of the following ways:
-
From the Map: Right-click on the map and select Overall Health View from the menu. The Runbook pane opens with an Overall Health View action node added.
-
From the Map Toolbar: Navigate to Runbook pane, and add Overall Health View node from the
 .
.

Tip: To set up a default Data View Template for the Overall Health View, navigate to Domain Management > Advanced Setting > Overall Health.
Tip: If a runbook is open, the Overall Health View action will be added to the current Runbook. Otherwise, it will be added to the personal runbook.
-
From the Map: Right-click on the map and select Overall Health View from the menu. The Runbook pane opens with an Overall Health View action node added.
-
Before running the node, you can configure the following settings:
-
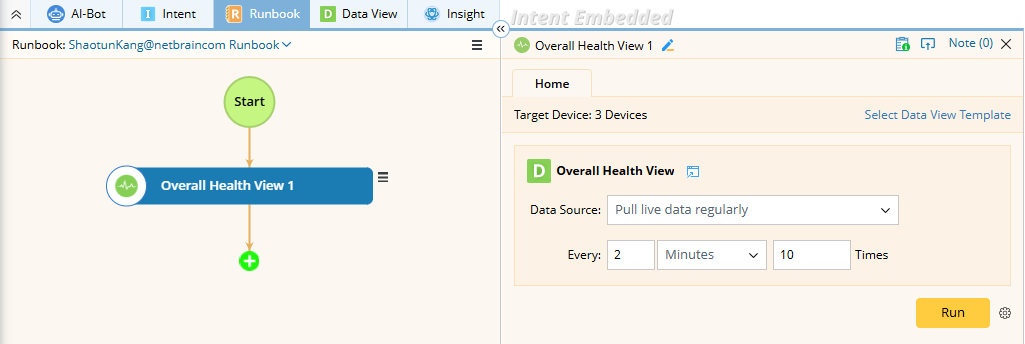
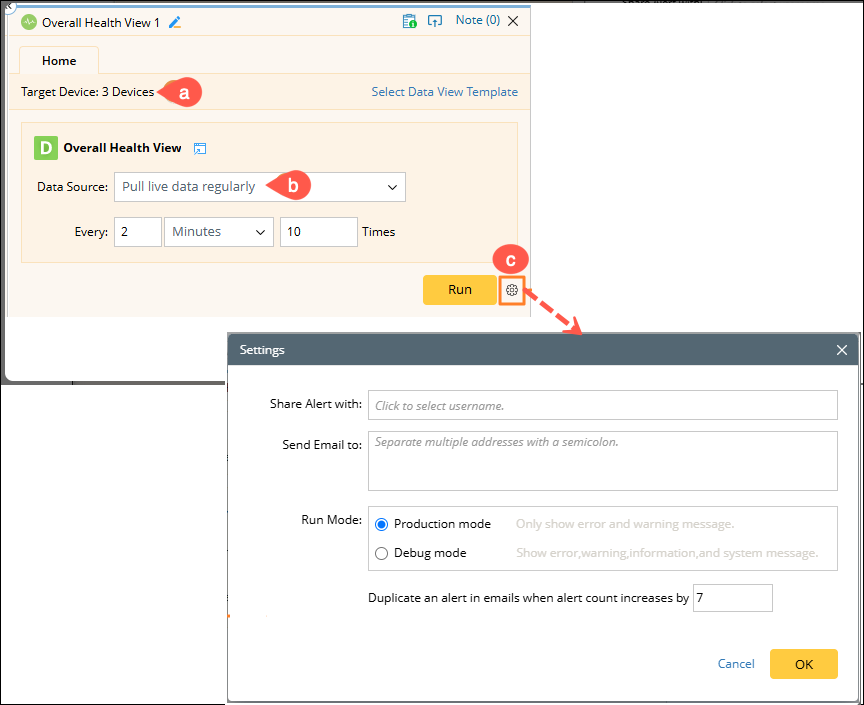
Device Selection: All devices and paths on the current map are auto-populated.
Note: You cannot add or delete devices, Data View Template can only be applied to devices on the map. -
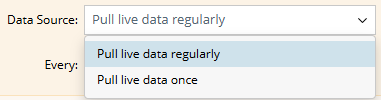
Data Source: The Pull Live data regularly is the default data source to run the Data View. You can also select other data sources to execute.
-
Alert Sharing: To share alerts with more users or send alerts via email, click the
 icon next to the Run button.
-
Device Selection: All devices and paths on the current map are auto-populated.
- Click Run to execute the overall health view. Results will be displayed on the map.

Tip: To reuse this action node with the same configuration, hover over the Overall Health View node in the Runbook, click the
 icon next to the node name, and select Save as Favorite.
-
To view the results, click any numeric value displayed on the map and the result pane will expand. A chart will appear showing the monitoring metrics of this device over a period.

- During the monitor process, the color of devices and interfaces may change, indicating the corresponding status described as follows:
| Device Icon | Description |

|
The value of the predefined device variable dev_status is Up. |

|
The value of the predefined device variable dev_status is Down. |
| Link Icon | Description |

|
The value of the predefined interface variable intf_status is Up. |

|
The defined interface variable intf_status is Down. |
| Data Unit Icon | Description |

|
The data unit reaches the predefined threshold of an error alert. |

|
The data unit reaches the predefined threshold of a warning alert. |