Data View
The Data View node is used to monitor devices and device interfaces by visualizing variable values on a map. It can highlight variable values in different colors and output alert messages when the variable values reach the predefined threshold.
Configuring a Data View Node
- Point to the upstream table node that you want to analyze the variables.
- Click the
 icon and extend a Data View node from the table.
 - At the Data View node, click Select Data Unit. The Select Data View dialog opens. Define data units to display based on the Table type:
- Device Data Table
- Select a device data table in the left pane.
- Select the variables you want to display on the map. You can add device-level variables (such as CPU and memory) or interface-level variables (such as MTU and bandwidth). You can also select a table to monitor and display all variables in table format.
- Click OK.
The variables will be displayed as follows. To remove an item, point to it and click the icon to select Delete from the drop-down menu.
- Global Data Table
- Select a global data table in the left pane.
- Select the device variable (_device by default) from the Device drop-down menu.
- Select the interface key from the Interface drop-down menu.
- Select the variables that you want to monitor under the Variable list.
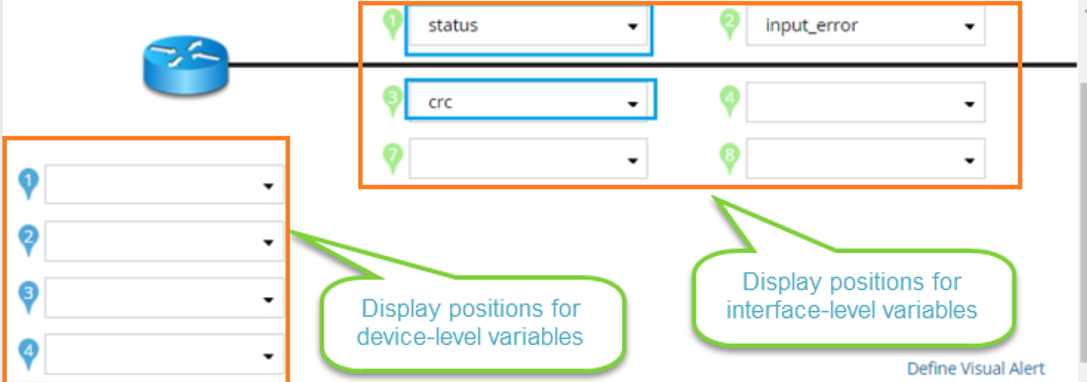
- Specify the display positions for each variable on a map.
- Define Alert for variables.
When a variable reaches the predefined conditions, the system highlights the variable and sending alert notifications in Event Console.
Example: Define an alert condition for the variable $input_error (interface input error).
- Click the
 icon to define an alert condition for $input_error.
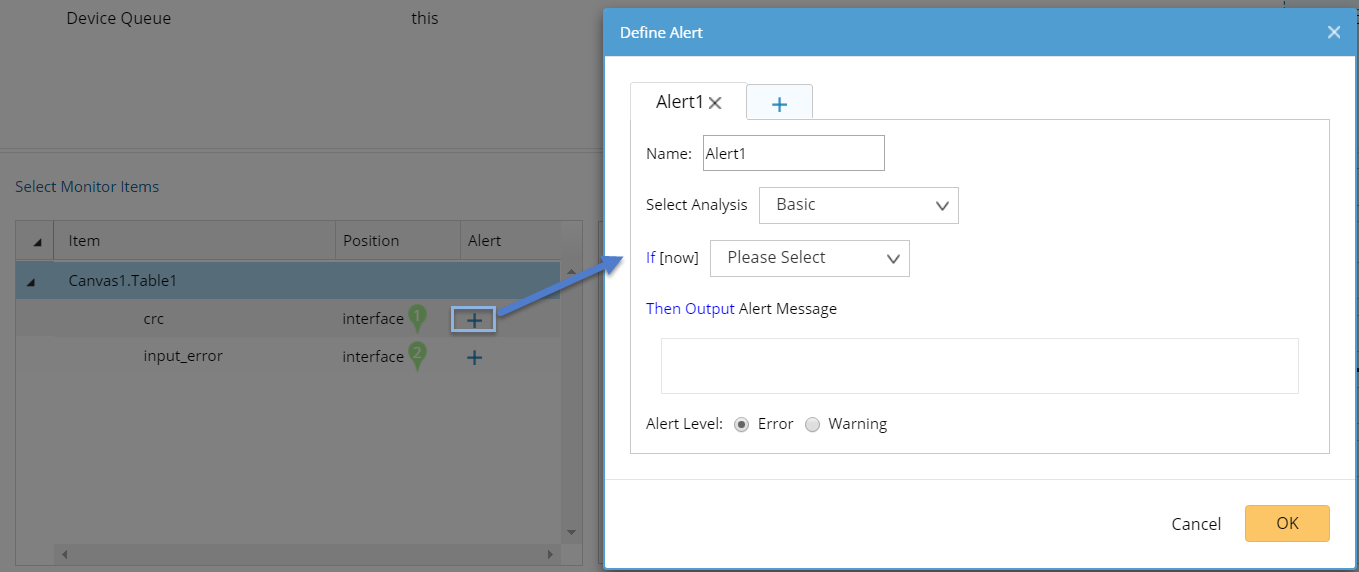
- Select the analysis type to set conditions. The alert will be triggered as soon as the conditions are met.
- Click the
- Basic
Basic is the most frequently used method to compare the real-time data with the pre-defined threshold.
For example, to trigger an alert when there is any interface input error.
When the value of $input_error exceeds 0, the alert will be triggered.
- Flapping
Flapping is used to check how frequently a variable changes or flaps.
Example: Trigger an alert when the $input_error variable has 5 changes in the latest 50 data samples:
- Select Is flapping from the drop-down list.
- Enter 5 changes in last 50 data in the blank fields.
- Enter the message: “The input errors keep increasing!”.
- Advanced
Advanced enables you to write complex conditions in Python codes directly. See Python Scripting for reference.
Example: Trigger an alert when there is any interface input error or the value of $input_error changes.
- Enter [now] != None or ([now]-[last])>=1 in the blank field.
- [now] — the value of the current poll cycle.
- [last] — the value of the last poll cycle.
- [last-N] — the value of the [last-N]th poll cycle.
- Enter the message: “The number increase fast!”
- Select the alert level. The difference between the two levels is only in the color and text display.
- Enter [now] != None or ([now]-[last])>=1 in the blank field.
- How to define visual alerts?
The visual alert refers to highlight devices or interfaces on the map when the specific alert of monitoring items triggers.
- Click Define Visual Alert and the following dialog prompts. The monitor items defined with alerts in step 4 are listed here.

- Specify which variable change will cause the device or interface color change. You can select multiple variables.
- If you want to set complex conditions to involve multiple variables, you can click New Compound Alert to define Compound Alert.
- Specify the Compound Alert type between Device and Interface.
- Set conditions for variables. See Defining Alert for more details.
- Enter the alert messages and select the alert level.
- Click OK.
- Repeat step 3) to add more Compound Alerts.
- Click OK.
- How to display multiple monitor items in one position?
To utilize positions on the map more efficiently, you can merge monitor items within one category (device items or interface items).
- Press the Shift or Ctrl key on your keyboard to select multiple monitor items and click the icon to select Merge Items from the drop-down menu.

- Enter a new name for the newly merged items and click OK.
- Select one position for the merged items.
- Press the Shift or Ctrl key on your keyboard to select multiple monitor items and click the