R12.1 Project Publication-2025Dec23
Apply a Dynamic Data View to View Alert and Drill Down

All devices on a map page are displayed in the Default Data View. You can directly apply a predefined data view template on the map to initiate network troubleshooting.
Example: Apply the data view of Overall Health Check to troubleshoot a slow application.
- On a map page, click Overall Health Check in the Dynamic Data View pane to preview it and then click Apply.


Tip: For more explanations about the number of Golden Baseline Alerts shown in the Data View pane, refer to Golden Baseline Alert Count. - Take an overview to understand the network design and operation status, and look into the alerts. Click an alerting metric to view its historical data in the Details pane.

Tip: See Detail Pane for more information about historical data analysis.
- Click 2 Recommended Actions, and select show log include INPUT [Cisco IOS NXOS ASA] to run a Qapp for further analysis.

- View the running result to address the root cause of the alert. In this case, the alert is caused by a duplex mismatch.

- Go back to the Details pane and select the duplex variable.
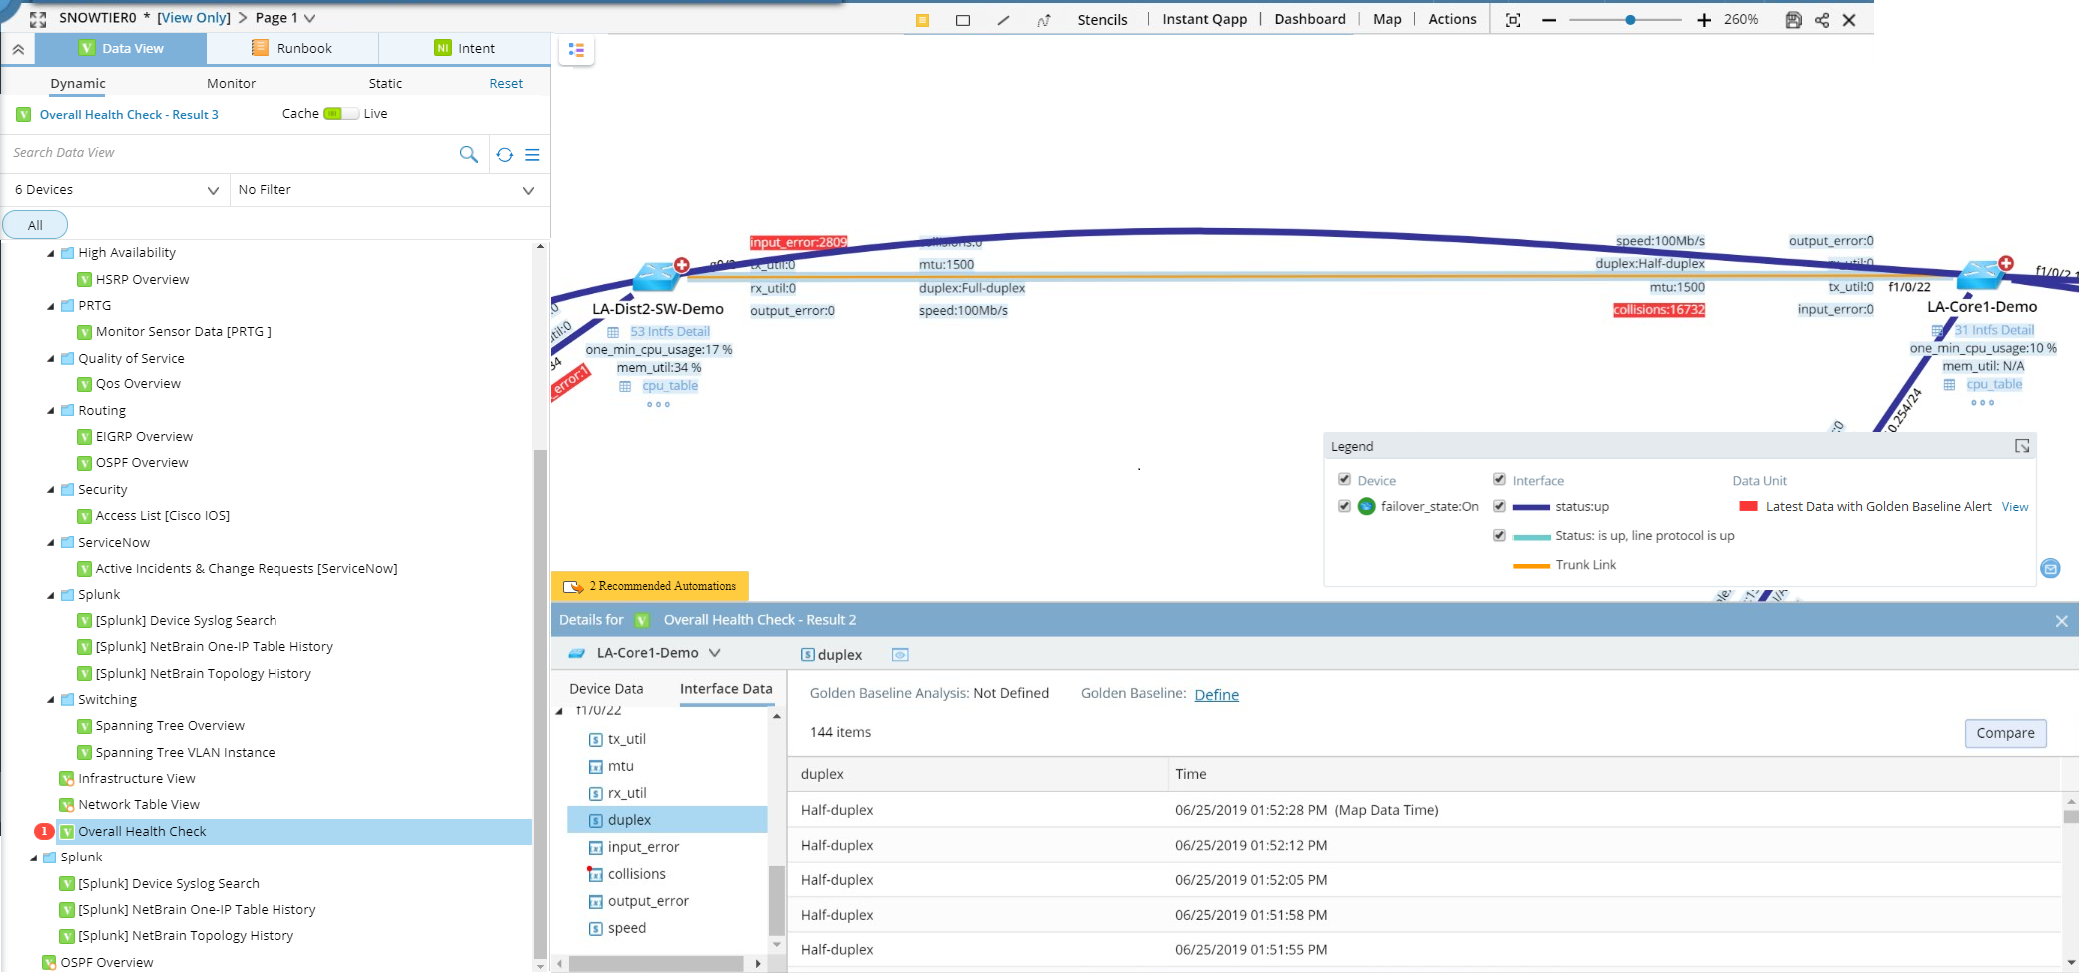
- Click Define to modify the rule as intfs_table.duplex Equals Full-duplex and re-apply the data view to proactively identify the anomaly.

With the enhanced Golden Baseline rule, your colleagues can track the issue easily.
|
|
Tip: If filter criteria are defined in the data view template, only the devices that match the criteria can generate data views. |
See also: