R12.1-JA-2025June05
Monitor Server and Service Metrics
NetworkBrain Service Monitor provides a portal for administrators to observe the health of deployed Windows and Linux servers, with operations management of related services. It collects various types of metrics data from these deployed servers and visualizes them in tables or line charts.

|
Note: The Service Monitor Agent must be installed on the servers you want to monitor. If you deploy more than one system across multiple data centers, you will have more than one Service Monitor portal. |
|
|
Note: The system auto-update feature requires the Service Monitor Agent to be installed. |
To monitor server and service metrics, complete the following steps:
- On the System Management page, click
 and select Service Monitor from the drop-down.
 - On the Service Monitor home page, you can monitor key server metrics, server connectivity, resource utilization, service status and more.
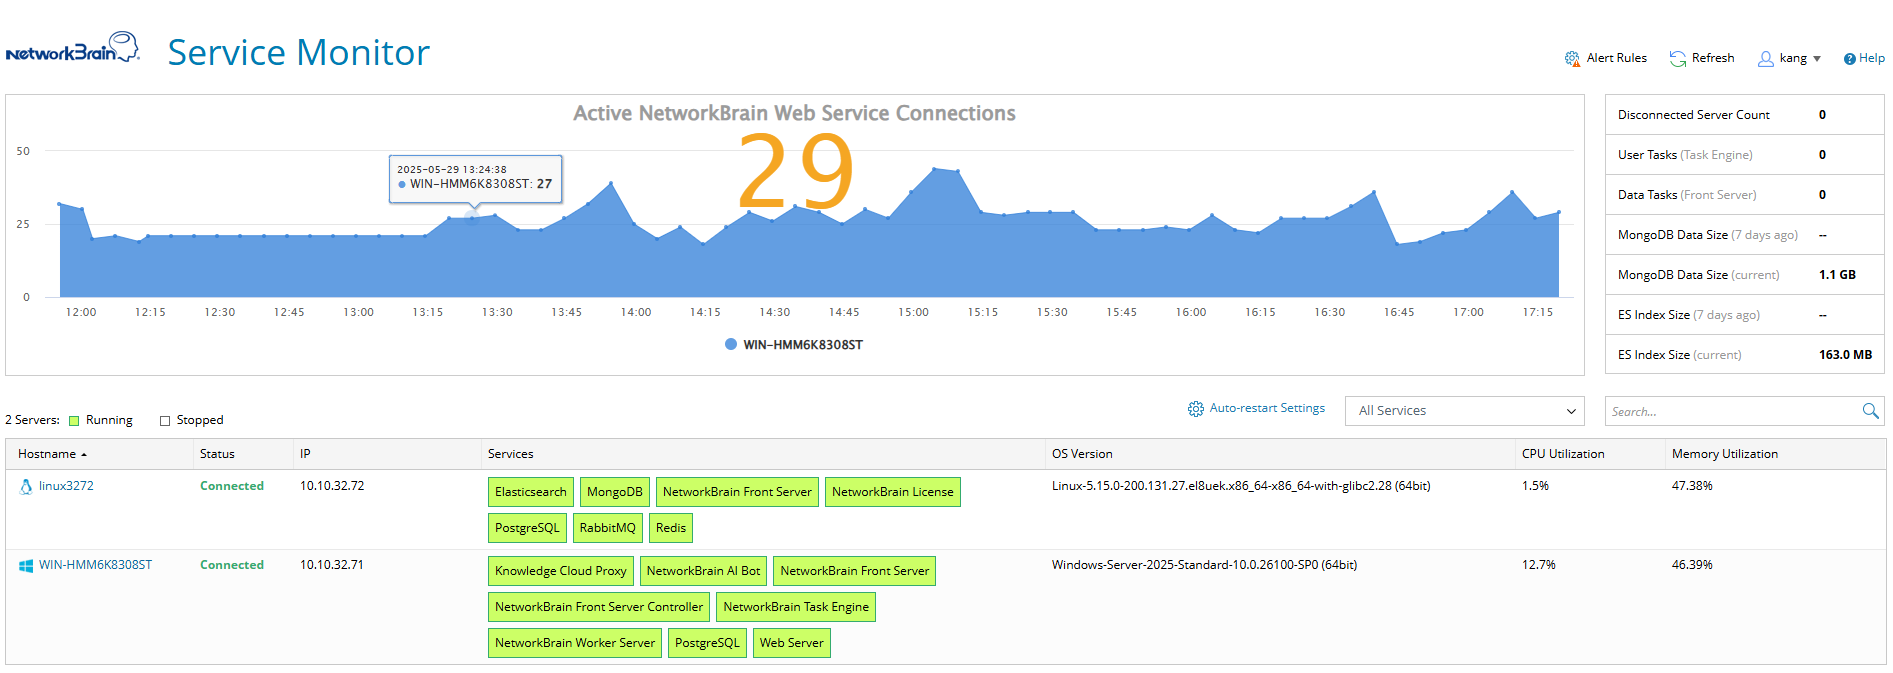
Note: You can click Refresh to view the latest data.
Note: You can filter services by service type or search service by entering a search keyword in the search bar. 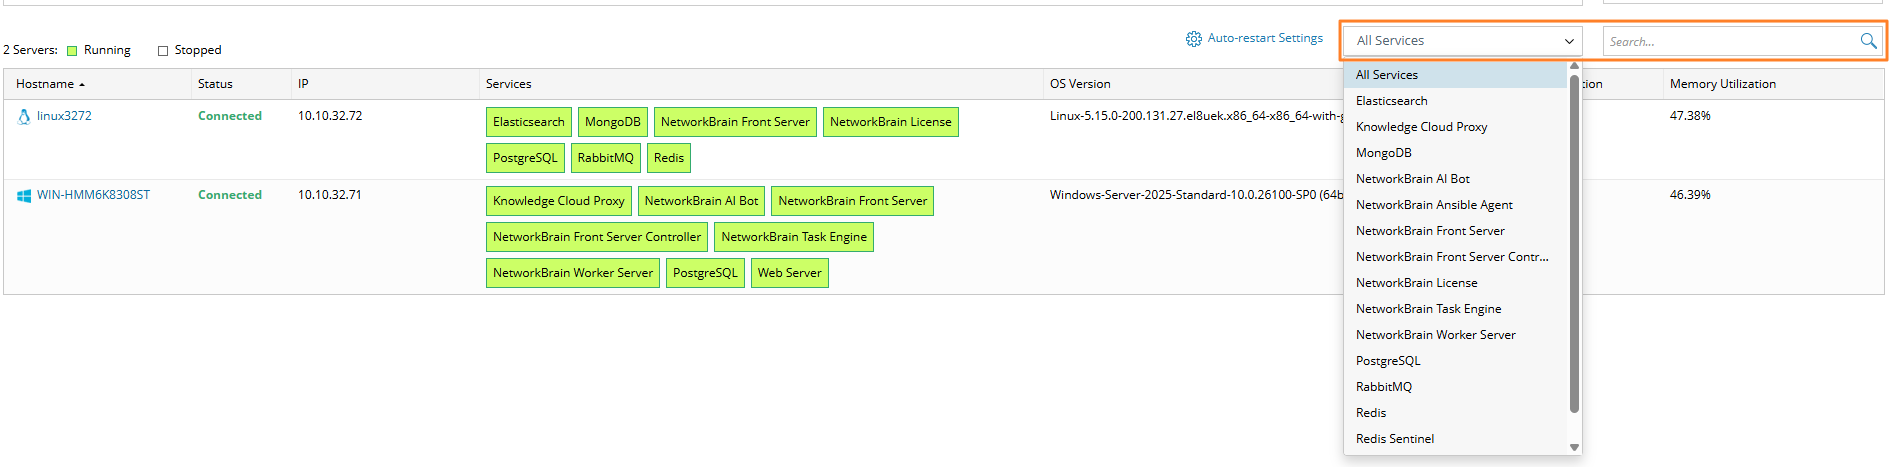
- Customize the conditions for when to send out alert emails and take more actions for low disk space on MongoDB by clicking Alert Rules. See Managing Alert Rules for more details.
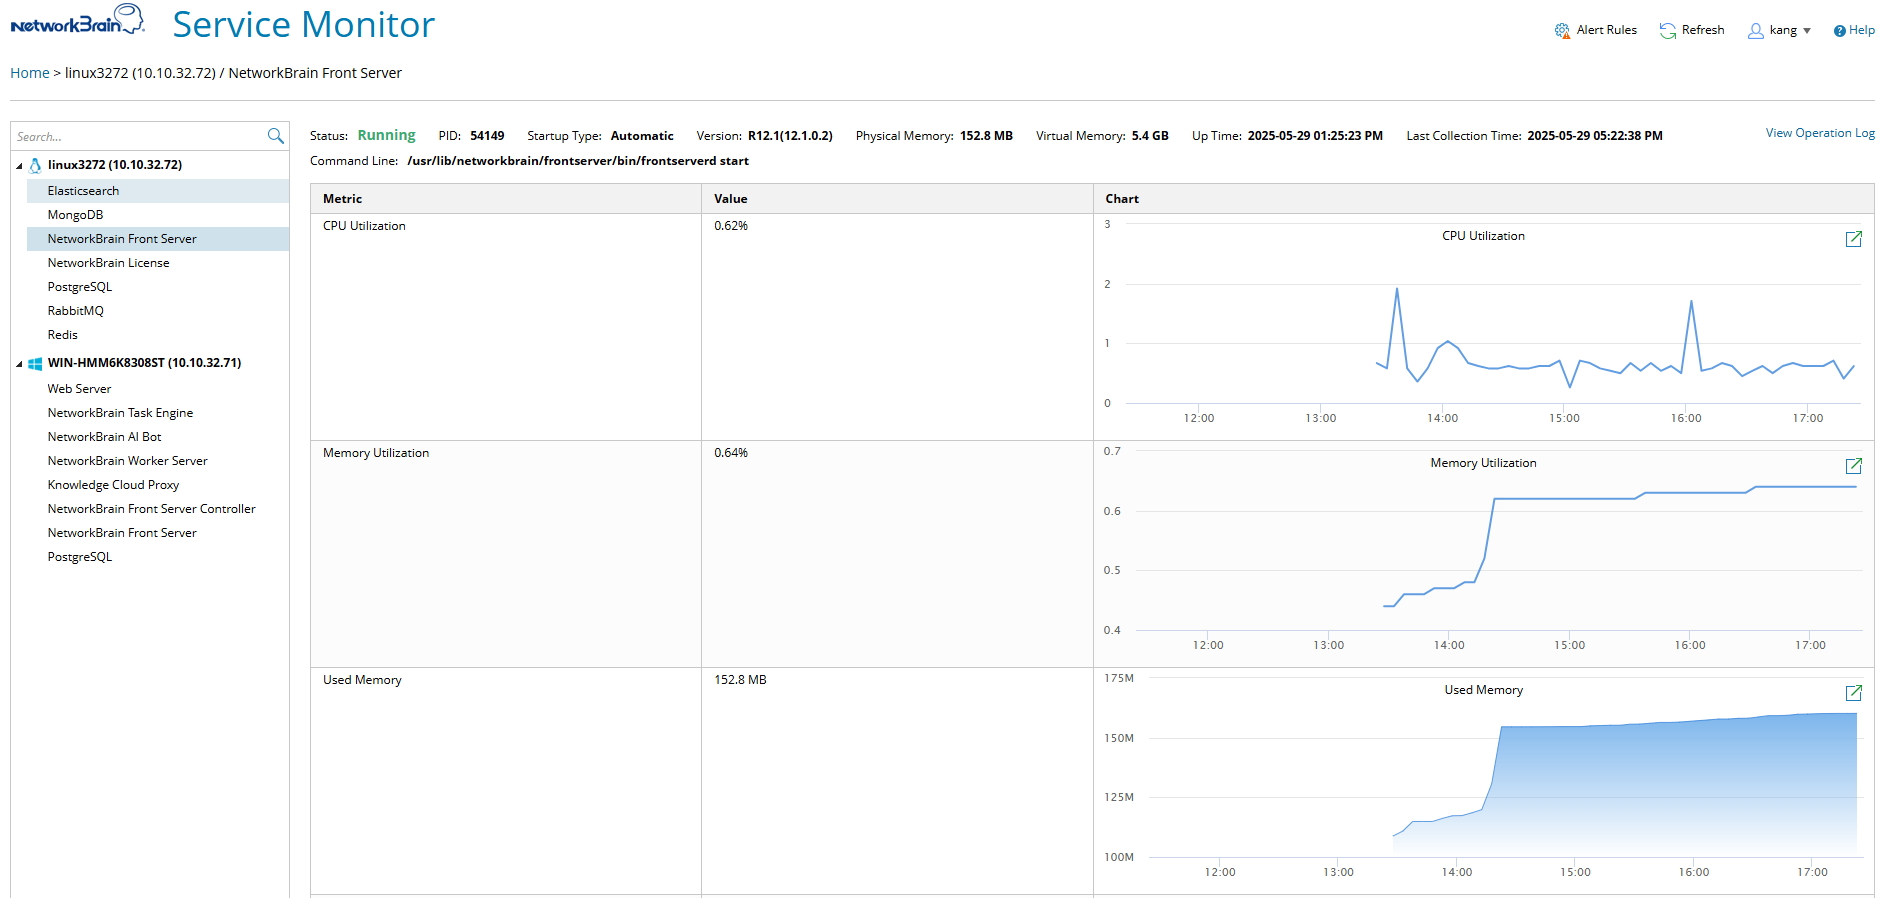
- To check detailed metrics for a specific service, click the service name to view details. See Service Metrics for more reference. By default, the system collects metric data every 5 minutes and refreshes the page every 5 minutes to display the latest metric data. You can click the Refresh button to update the metrics immediately.
See also: