Manage Logs
Users can collect and analyze the Logs of selected servers or services to automatically find potential problems in each component of a system. The Log feature in the NetworkBrain system enables users to collect and analyze log information about servers and services, such as service starting, stopping, or server failure, to help identify the cause of a problem.
The logic flow of collecting Logs is shown in the following diagram.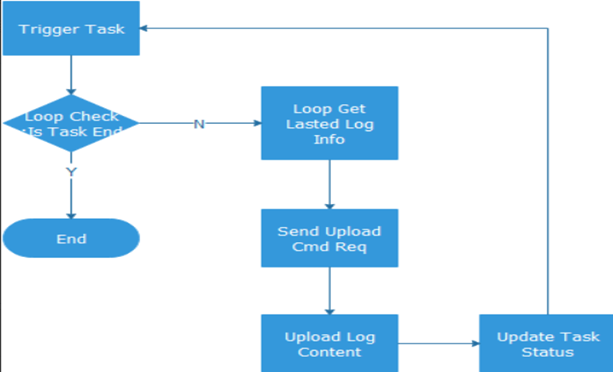
Collect Log
Users can access the collecting Log function from the User Account drop-down menu. 
Follow the steps to collect logs.
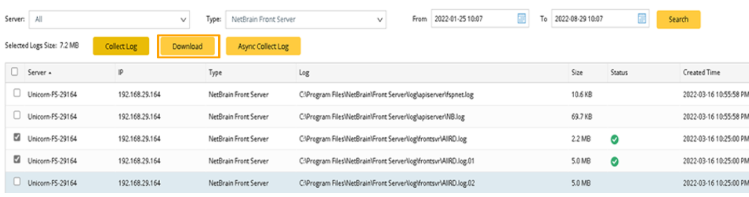
- Filter out desired logs by the server, service type and the period during which logs are generated.


Note: Users can reduce the redundant data by reserving only data generated within a specified period. 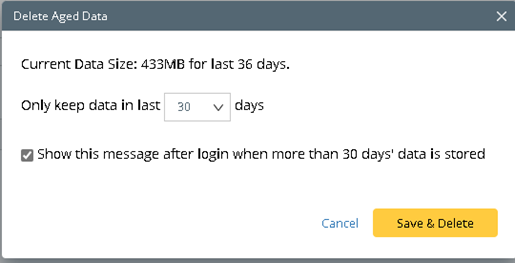
- Select log items and click Collect Log. The status will change to
 after successful log collection. An email notification is also automatically sent.
Note: The log collection process may take several minutes. Even if the collect Log page is closed during log collection, the collection process is still running at the backend.
- Download the collected logs.
Asynchronously Collect Log
The system supports the asynchronous logging feature. Logs can be accumulated and pushed to log files asynchronously to be added later in a reasonable size, avoiding slowing down the system during the logging process.
Follow the steps to asynchronously collect the log.
- Click Async Collect Log, then enter an email address in the pop-up window.
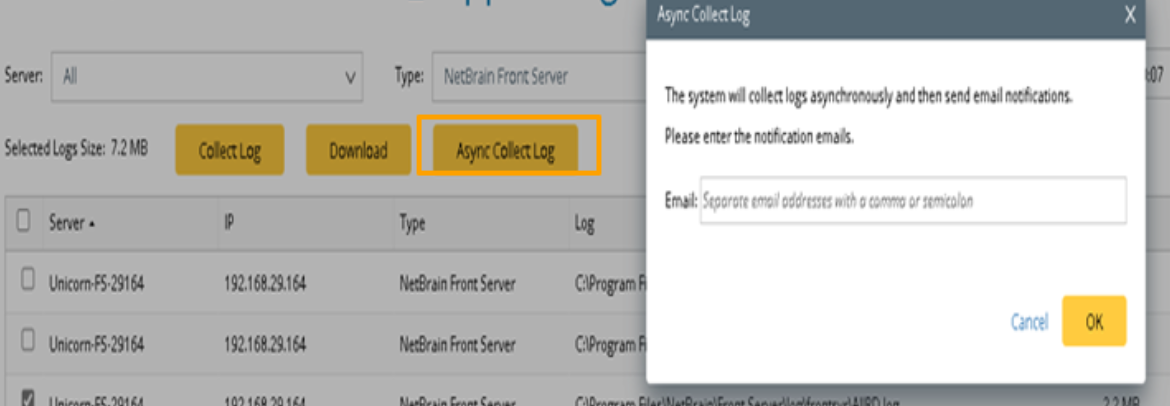
A notification will appear after submitting the task successfully.
- Receive email. An email is sent to report the log collection results.

- Click here in the received email to download the Log.
Analyze Log
Statistical analysis can be done based on the collected logs. Key information is extracted from the logs for each of the components to find potentially problematic components by providing examples of problematic logs and matching logs with the log example. In the process of the Log analysis, the incremental check is carried out to reduce the workload, and the checked data is managed according to the check time, and only the data generated after the most recent analysis will be checked.
The log analysis results include an abstract to give an overall summary of the existing problems and detailed information to give specific reasons for determining a problematic component.
- Open the page for log analysis from the User Account drop-down menu.

- Filter the logs to be analyzed by selecting the server, service type, and period, then click Analyzing.
- The potential problematic server and service will be listed.
Log Level Settings
To make use of this feature, follow the steps below:
- Access Log Level Settings from Service Monitor > Support Log page.
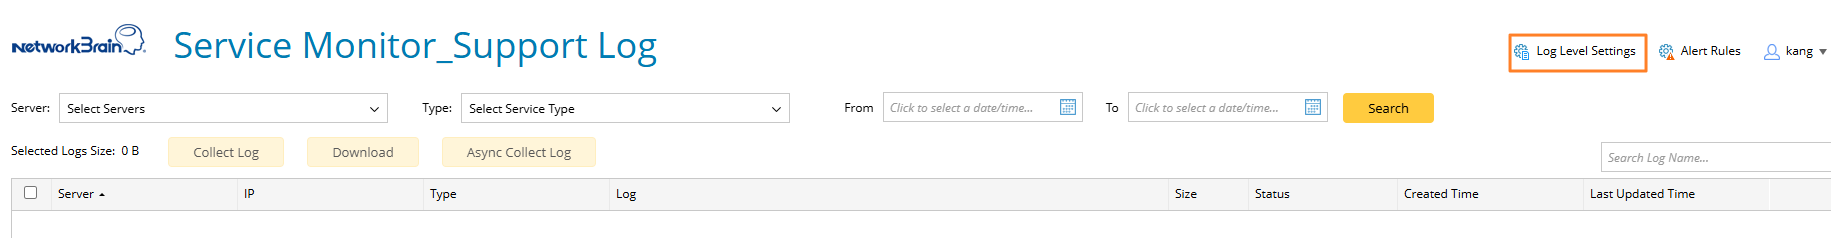
- Click Log Level Settings, then set the log levels for the three type of services.

- Select a type of service from the left pane
- Select the log level for this service. There are three log levels available: Warning, Information and Debug.
- Click Apply Changes to apply the settings.