R12.1-JA-2025June05
Preventive Automation Console
Preventive Automation Console (Dashboard) provides an overview of the network health status and statistics from the Preventive Automation for the entire or partial network. Also, the Preventive Automation Console (dashboard) allows drilling down to any device to view its alert and execution details.
To view Preventive Automation Console (Dashboard):
- Go to
 on the desktop and search Preventive Automation Console, select the option from the results to open it.
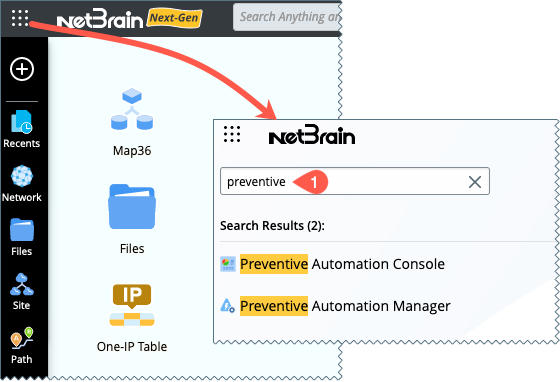
-
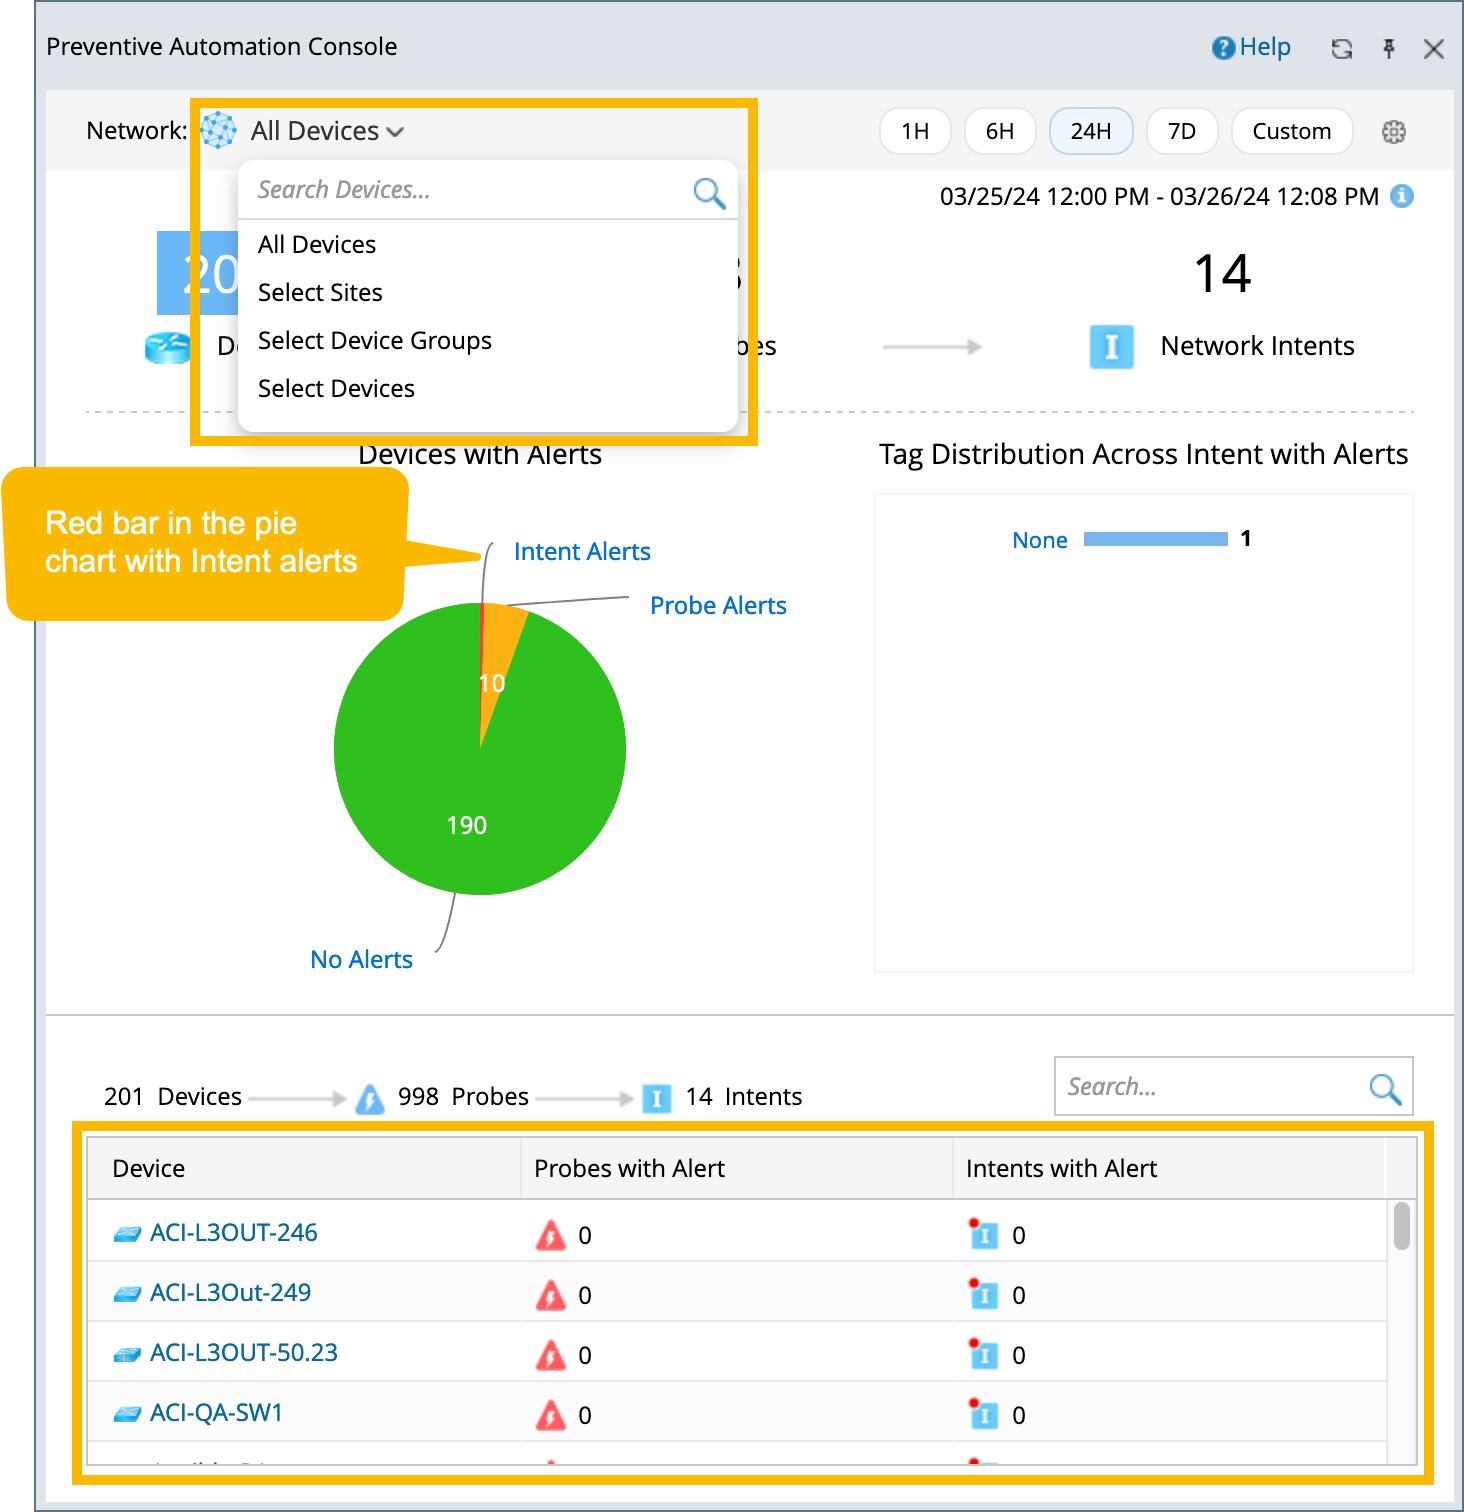
Select the Network device scope based on your specific need from the drop down menu.

- Search Devices: Use the hostname to search for a specific device.
- All Devices (default): View the results for all devices.
- Select Sites: Select one or more sites to view the alert results of selected sites.
- Select Devices: Select one or multiple devices to view the alert results.
- Current Map: If a map is opened, you can select this option to quickly view the alert results for devices within this map page.
-
Select any one of the following to see the results in a tabular list.
- Count of the Devices.
- Bar in the pie chart located under Devices with Alerts.
-
Tag located under Tag Distribution Across Intent With Alerts.

-
Select the time range to view the results across various periods.
By default, the Preventive Automation Console (Dashboard) displays the alert results during the last 24 hours. -
Review the results.
- Devices with Alerts: Shown as a pie chart, categorized based on the alert types.
- Intent Alerts: Number of devices whose probe triggered intent with alerts during the selected time range.
- Probe Alerts: Devices with only probe alerts during the selected time range.
- No Alerts: Devices without any active alert during the selected time range.
-
Tag Distribution Across Intent with Alerts: shown as a bar chart (on the right-hand side). It indicates the number of devices with network intent alerts under each specific intent tag.

Tip: Click each alert type in the pie chart, and the corresponding device(s) info will be shown as follow: 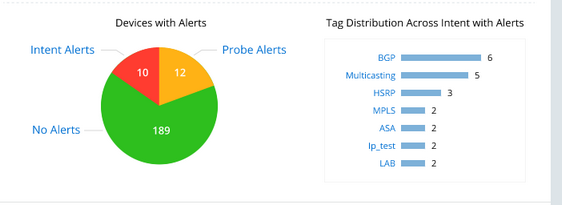
Tip: You can click on the interested tag bar to see the respective devices.
|
|
Note: The
Preventive Automation Console displays the alert results for all devices by default.
|
