R12.1-JA-2025June05
Use Network Dashboard to Visualize Multi-dimensional Data
In some monitoring or troubleshooting scenarios, you may want to browse the configuration files, data tables, performance statistics, and other data synchronously at a glance. Dashboard organizes and displays multi-dimensional data for diversified scenarios on a single page. The Dashboard is highly customizable and interactive, integrating real-time data, tables, and charts.
Main UI Components
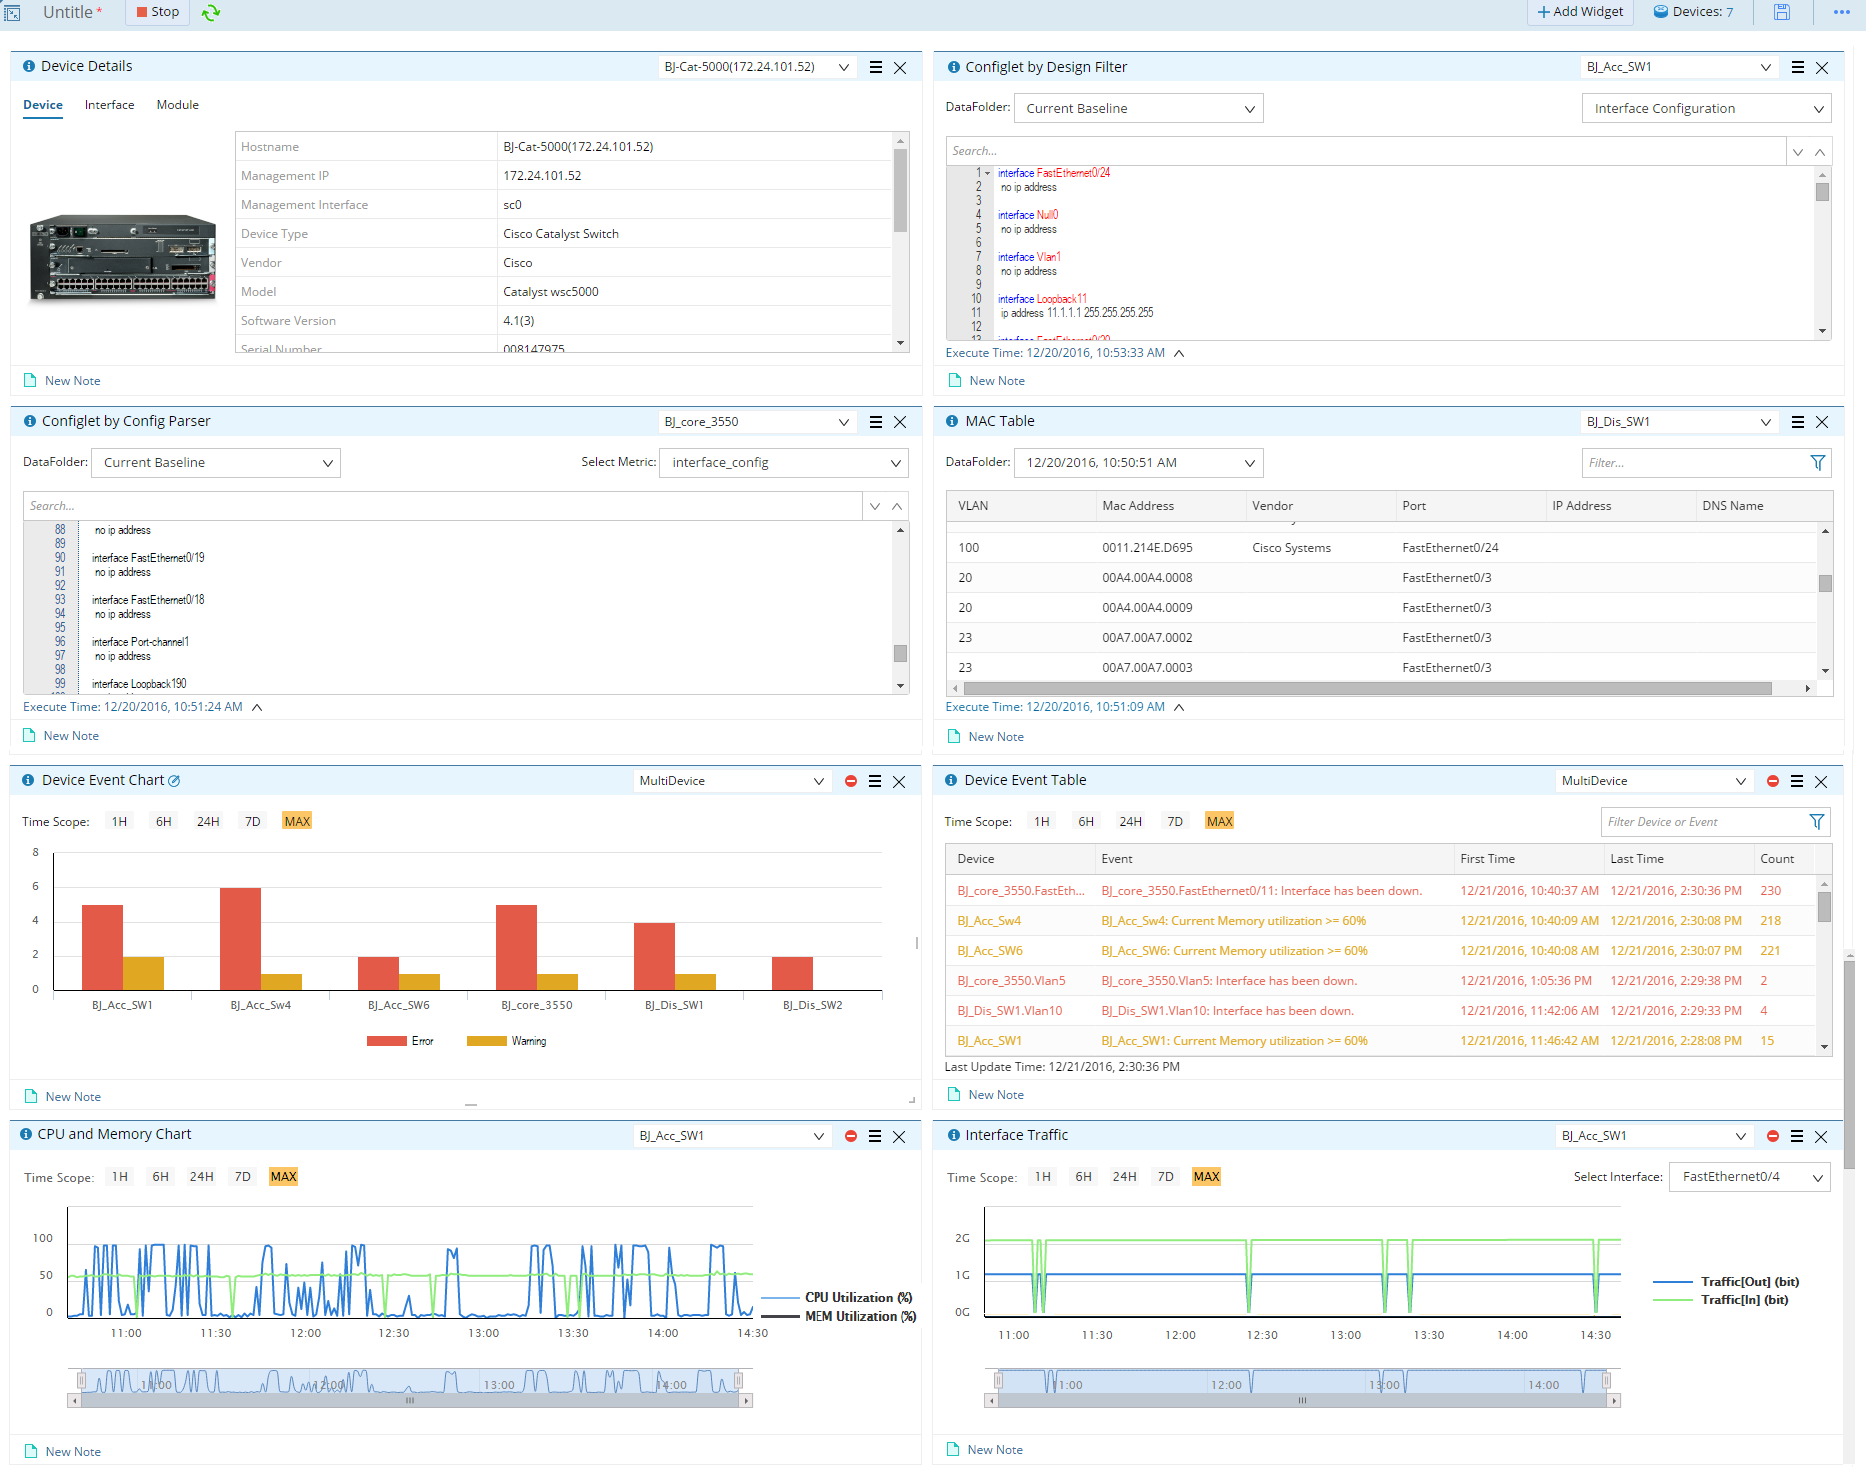
The UI (User Interface) of a Dashboard consists of:
- Dashboard Toolbar
- Various Widget
Main User Cases
This section describes three typical Dashboard user cases.
- User Case 1: Show multi-dimensional network data on one page:
- Draw target devices and interfaces on a map.
- Run an appropriate dashboard template to observe network data.
- User Case 2: Monitor target devices or interfaces continuously:
- Create a dashboard and add appropriate widgets.
- Specify the device scope, set the Dashboard to run periodically, and save the Dashboard.
- Open the Dashboard to view monitor results at any time.
- User Case 3: Share a dashboard template to troubleshoot a detected issue:
- Power User creates a widget and binds it with a Qapp for troubleshooting.
- Power User creates a dashboard template and adds the Widget into the template.
- Other users apply this dashboard template to troubleshoot the issue as needed.
This chapter covers the following topics: