Additional Diagnosis Types Summary
You can also add the following types of diagnosis:
SNMP Diagnosis

After obtaining the SNMP baseline data, you can use the visual Parser to parse the variables.

SNMP diagnosis supports referencing SNMP OIDs corresponding to three specific variables, such as $cpu_oid and $mem_oid. It also supports multiple OIDs, which are separated by double vertical bars (||), such as SNMPGet $cpu_oid||$mem_oid.

API Diagnosis
You can add API diagnosis to enable the diagnosis of SDN/Cloud Network and SPOG Data View from an external system via REST API (such as Splunk, SolarWinds, and ServiceNow). You can add and retrieve the values from API Data Library without involving the functionalities like parsers. In the NI Editor, add the API section from the drop down menu and:
- Select API Data to Retrieve to choose an API Data from library which has a pre-defined list of API data.
- Modify API parameters (if required) and select the API Data.
- Also, you can choose to customize the API Data function script. The Retrieve Data Function is defined by Python script, and it is defined same as the advanced API parser.
Use JSON Group to parser the JSON result into a table. After retrieving the JSON data by the defined retrieve data function, use JSON Group to parser the JSON result. JSON Group will read all the keys from the JSON result and convert the JSON result to Table Format by selecting the JSON key.
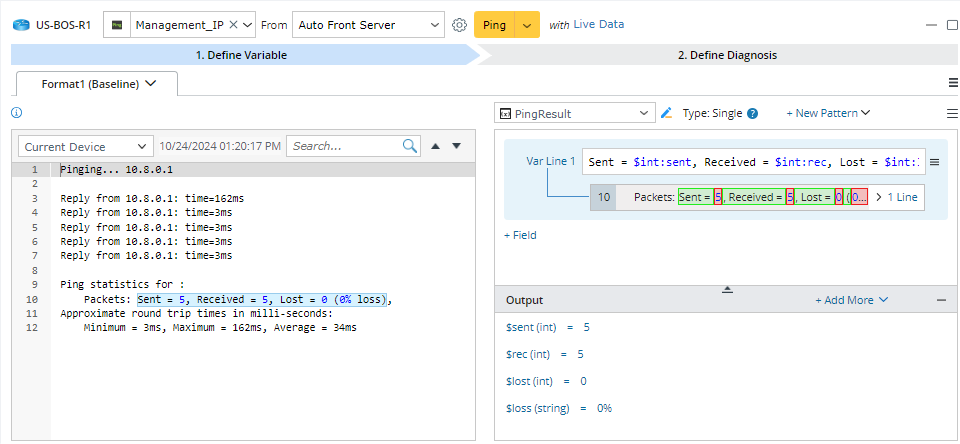
Ping Diagnosis
To diagnose device connectivity, you can add a Ping diagnosis to ping the current device via front server.
In the Add Ping Diagnosis dialog, select a front server to ping the current device, and click Settings to set more settings.
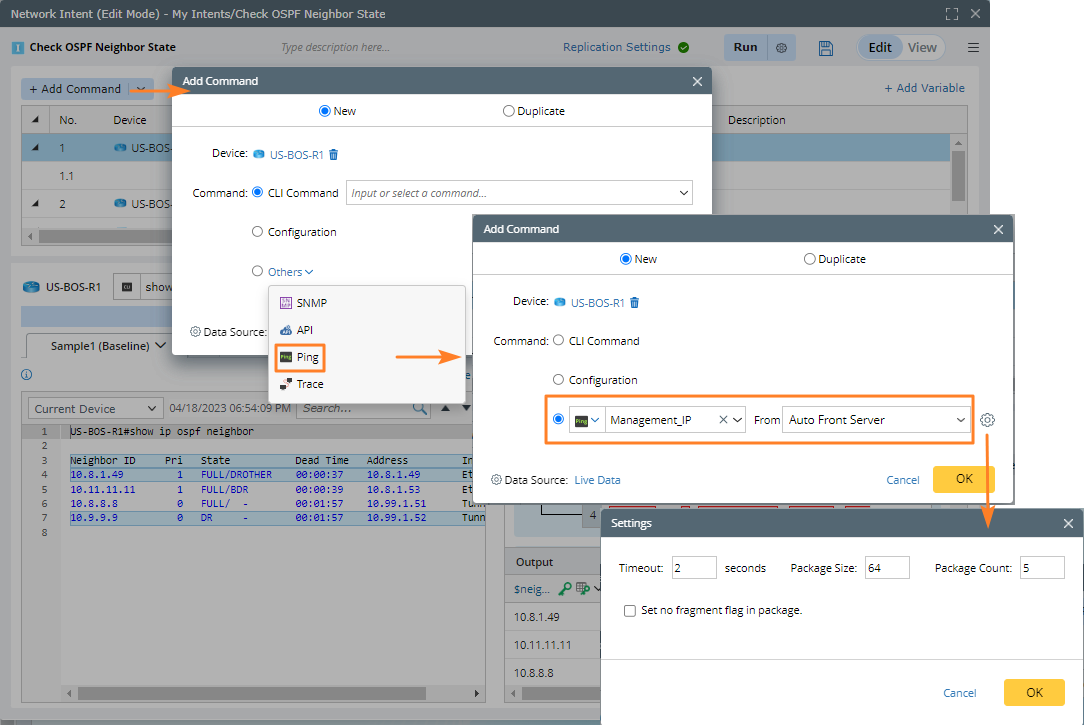
Click OK and the result is displayed.
Trace Diagnosis
To diagnose device connectivity, you can also add a Trace diagnosis to ping the current device via front server.
In the Add Trace Diagnosis dialog, select a front server to trace to the current device, and click Settings to set more settings.
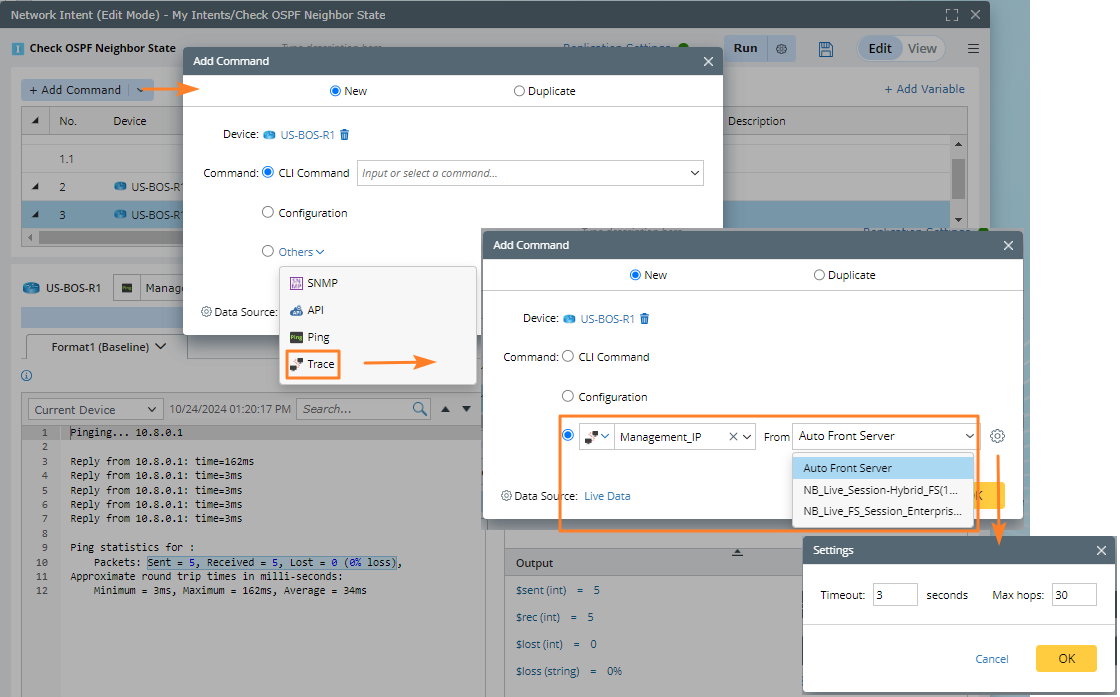
Click OK and the result is displayed.
