View Path Log
Logs for the A/B path can be checked instantly or in saved history records.
Viewing Instant Path Log
After you calculate a path, the path flow diagram is displayed. To view more information, click any hop or Path Detail to view the device log, traffic state, relevant data, and execution log.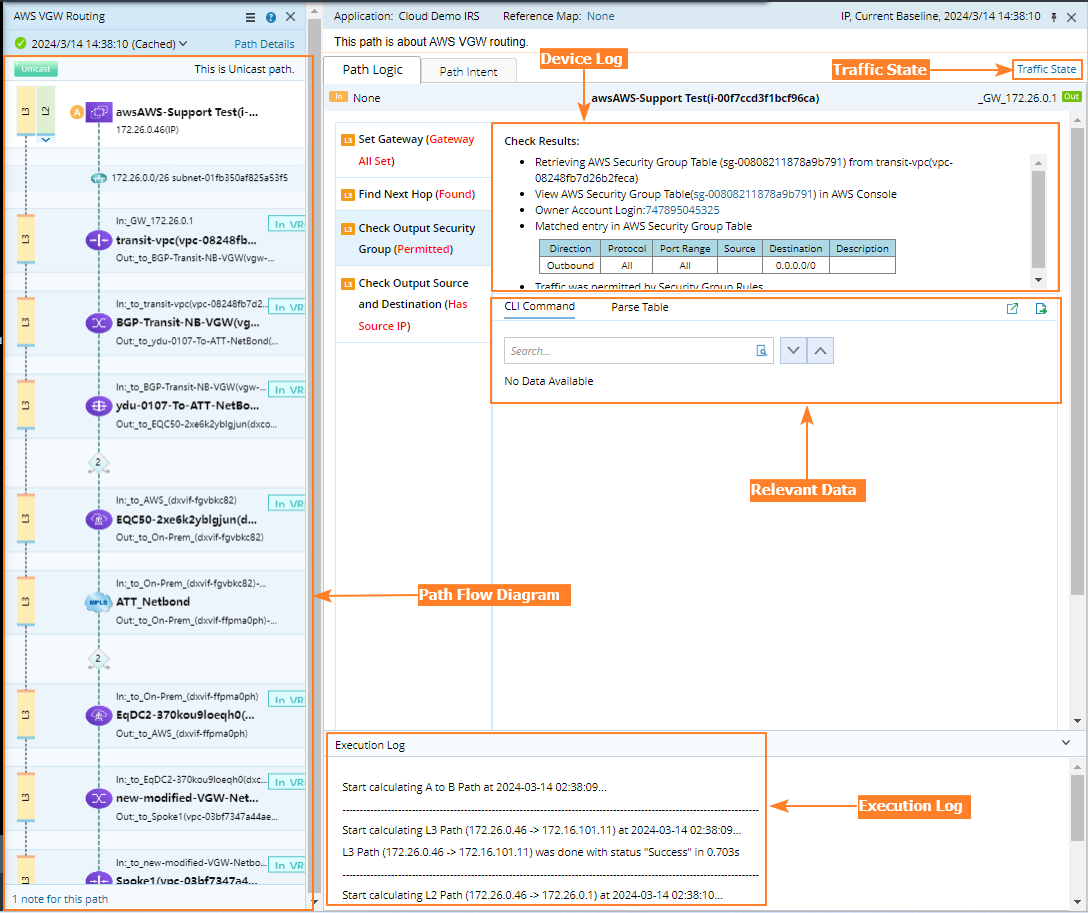

|
Tip: Upon any path issues, you can quickly submit problematic paths to NetBrain with one click. To do so, click the  icon in the Path Result Pane and select Contact NetBrain. icon in the Path Result Pane and select Contact NetBrain.
|
| Component | Description | Operations |
| Path Flow Diagram | Display each hop along a path. |
Note: The icon is only displayed when you calculate a two-way path.
|
| Device Log | Display technologies evaluated on each device during path calculation. | Click a device icon in the path flow diagram to browse the device's log under the Device Log tab. Or click the Tip: By default, the Only show steps matched with the device checkbox is selected to hide the technologies that the system failed to evaluate or that do not exist on the device. You can clear the checkbox to view all technology evaluating steps. |
| Relevant Data | Display relevant data which is used for path calculation. | Choose the 'CLI command' or 'Data Table' tab to view the raw CLI data or parsed data table. |
| Execution Log | Display execution steps recorded with time stamps. | Click the  icon to expand execution log; click the icon to expand execution log; click the  icon to collapse execution log. icon to collapse execution log. |
| Traffic State | Display the emulated traffic state reflecting the real transfer traffic status and used to find the next-hop device along the path, but that is not the real traffic state of your live network. All data is generated via show commands and user inputs. | By default, the traffic state is not displayed. To view the traffic state of the path, click the Traffic State tab. |


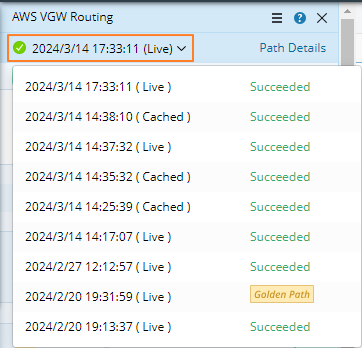
Viewing Historical Path Log
To view the log of a saved path:
- Click Path on the taskbar.
- In the Path Browser, click the number in the History column of the target path entry. A floating box prompts to display all history results of the path by timestamp.
- You can select which history path you want to show on a map.
- Double-click the Path entry in Path Browser to open the Path results pane.
- You can also check more History results.
- See Instant Path Log for more details.