There are different types of flash probes in the NetBrain system. Here we use the primary alert-based flash probe as an example to illustrate the basic procedures of defining flash probe:
-
Click
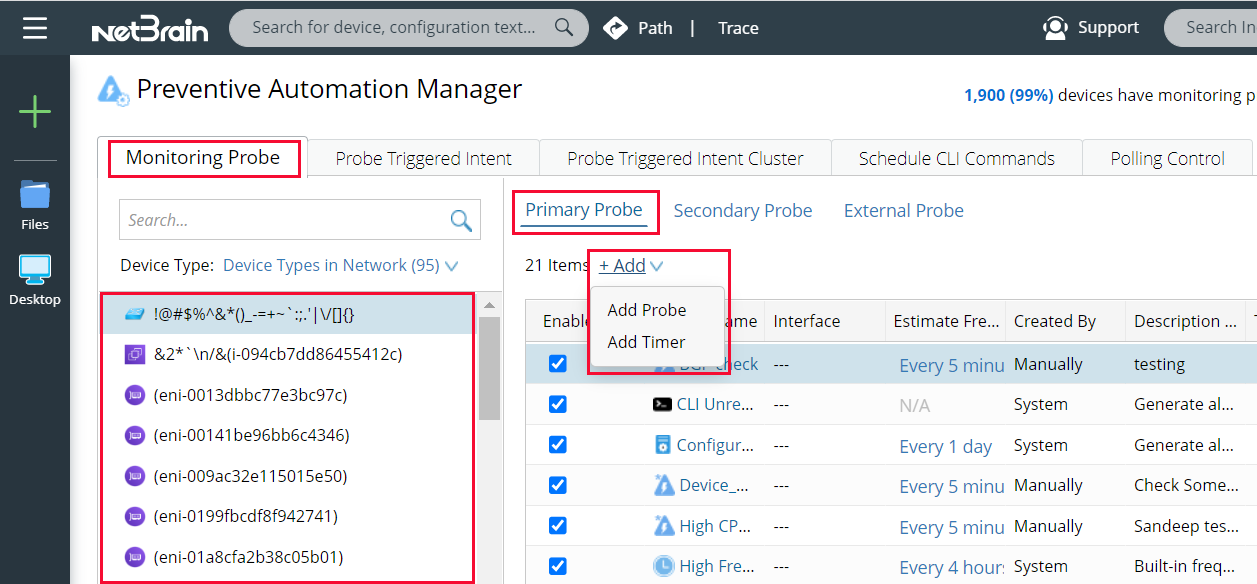
 on the task bar and select Preventive Automation Manager from the menu.
-
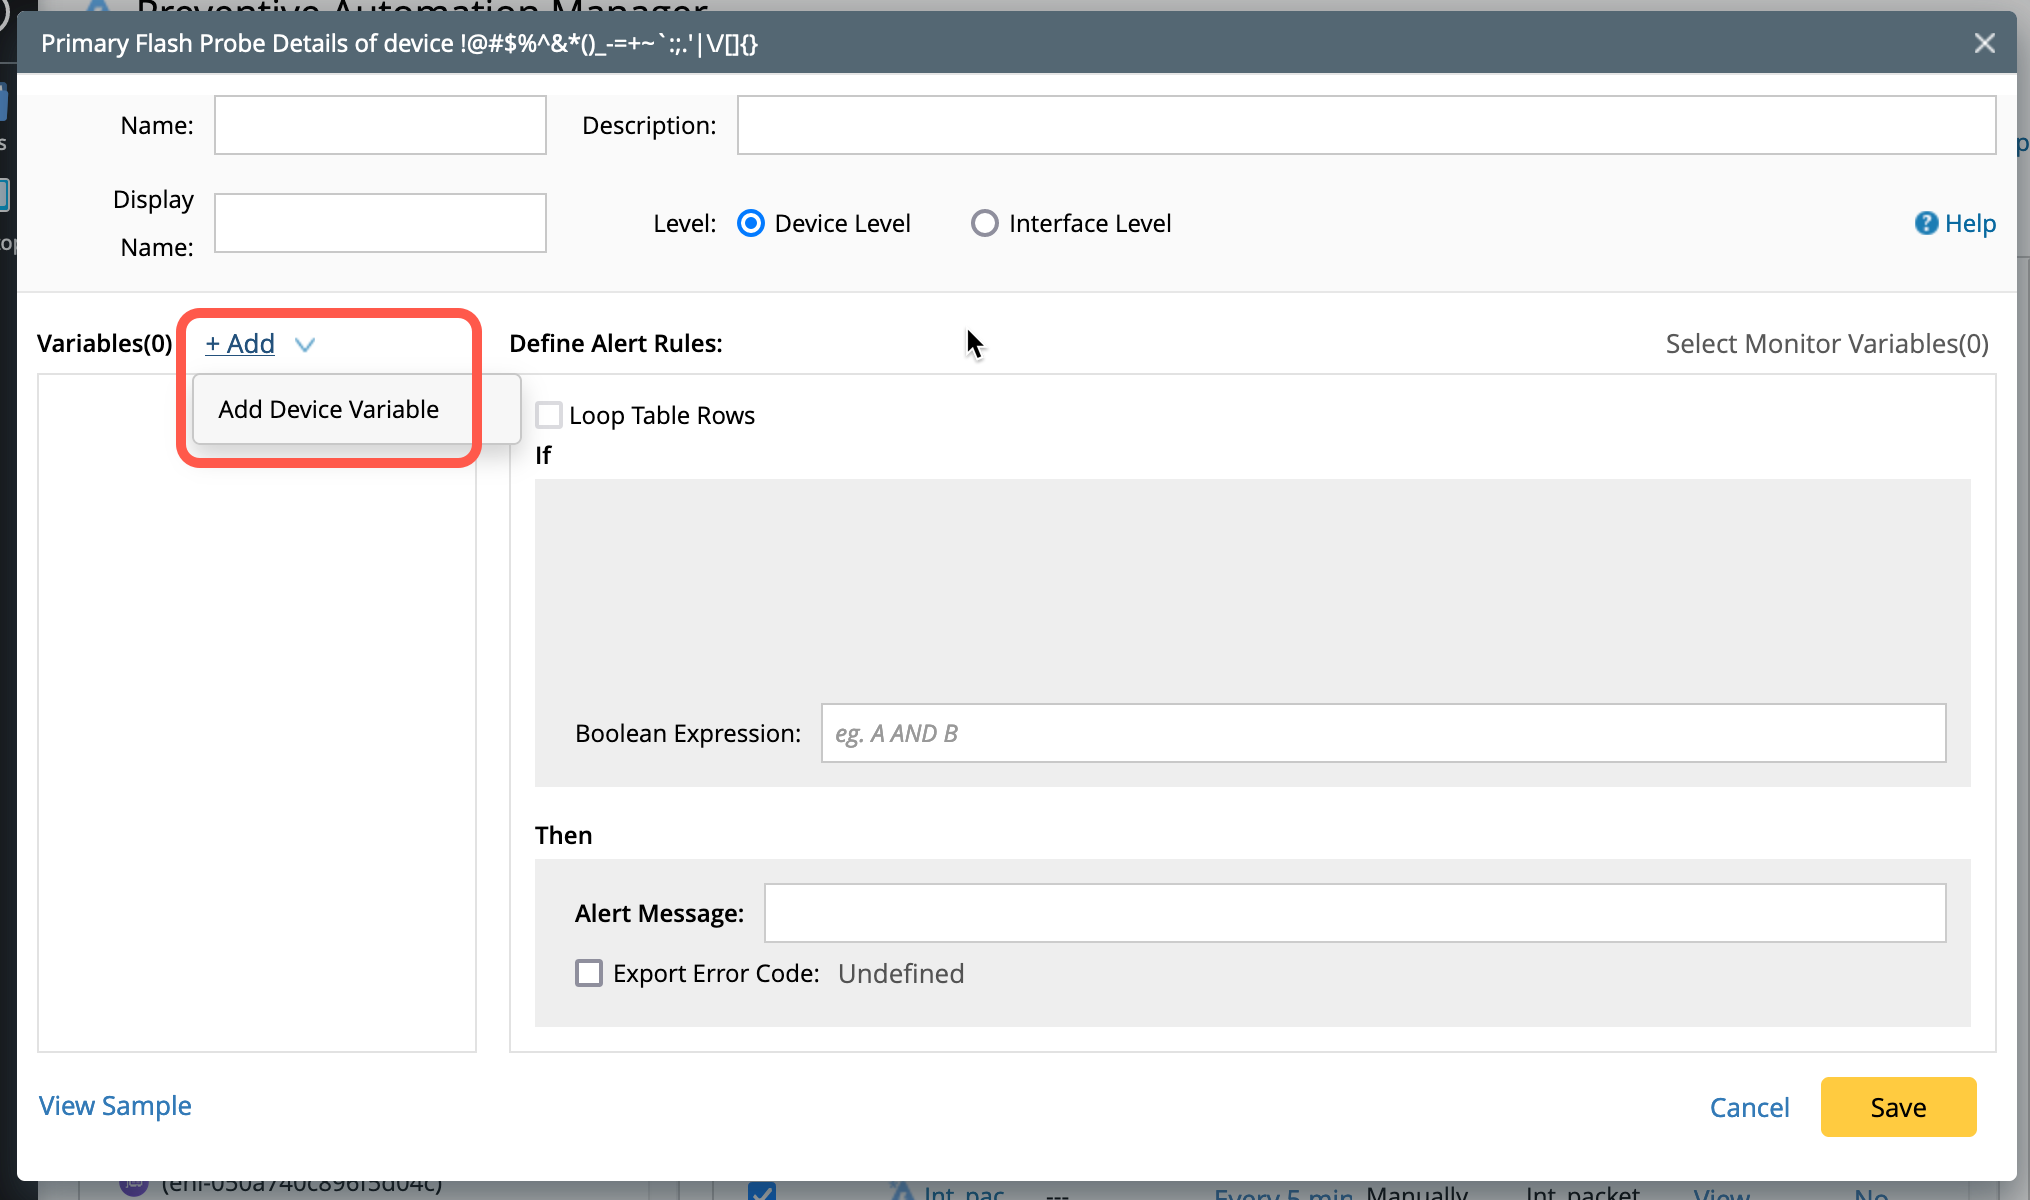
Click the Monitoring Probe tab and Primary Probe tab, select the target device on the left and click +Add. From the drop-down list, select Add Probe.
-
Define the basic information, such as the Name, Display Name and Description of the flash probe.
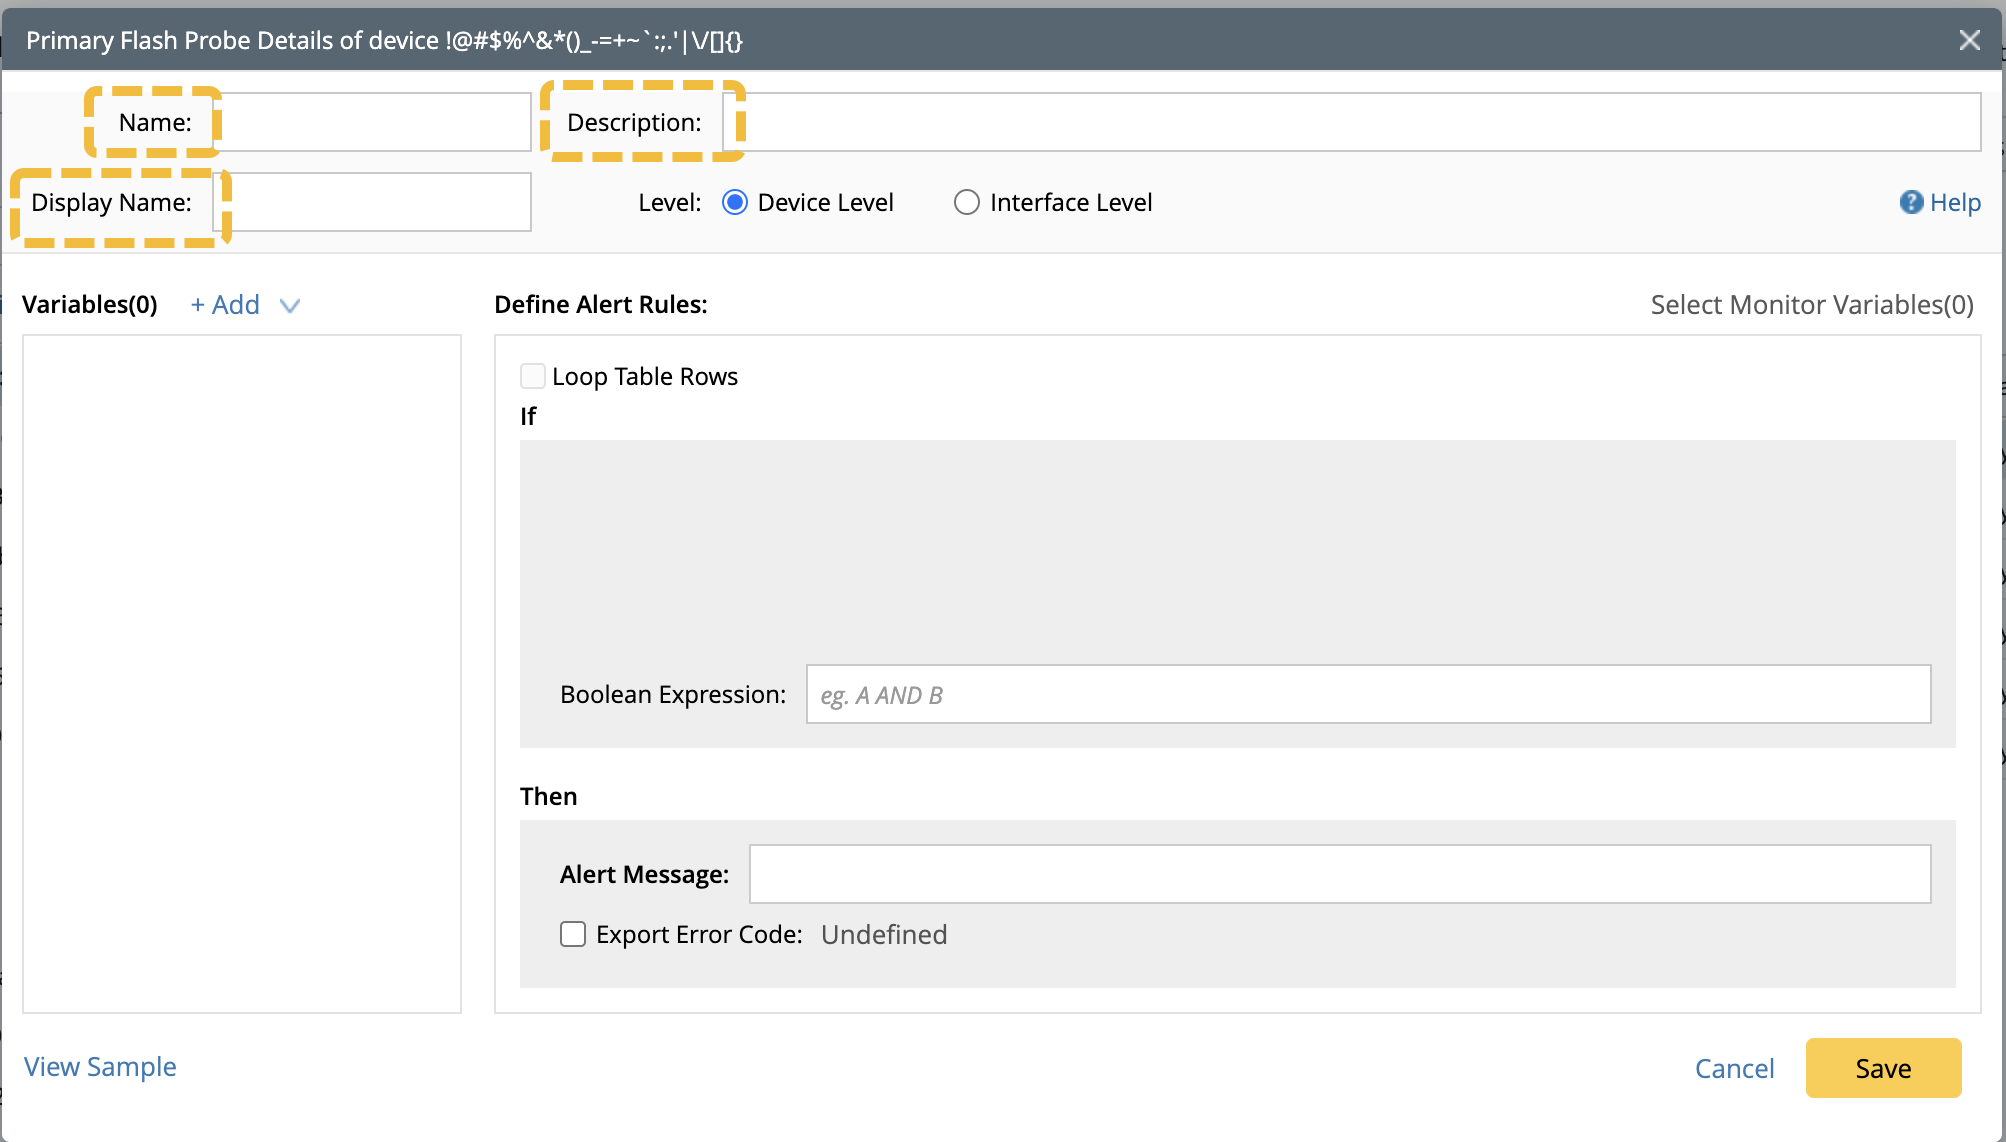
-
Configuring the Level setting:
-
To capture device-level anomalies, such as CPU high, device config change, and BGP neighbor flapping, select Device Level.
-
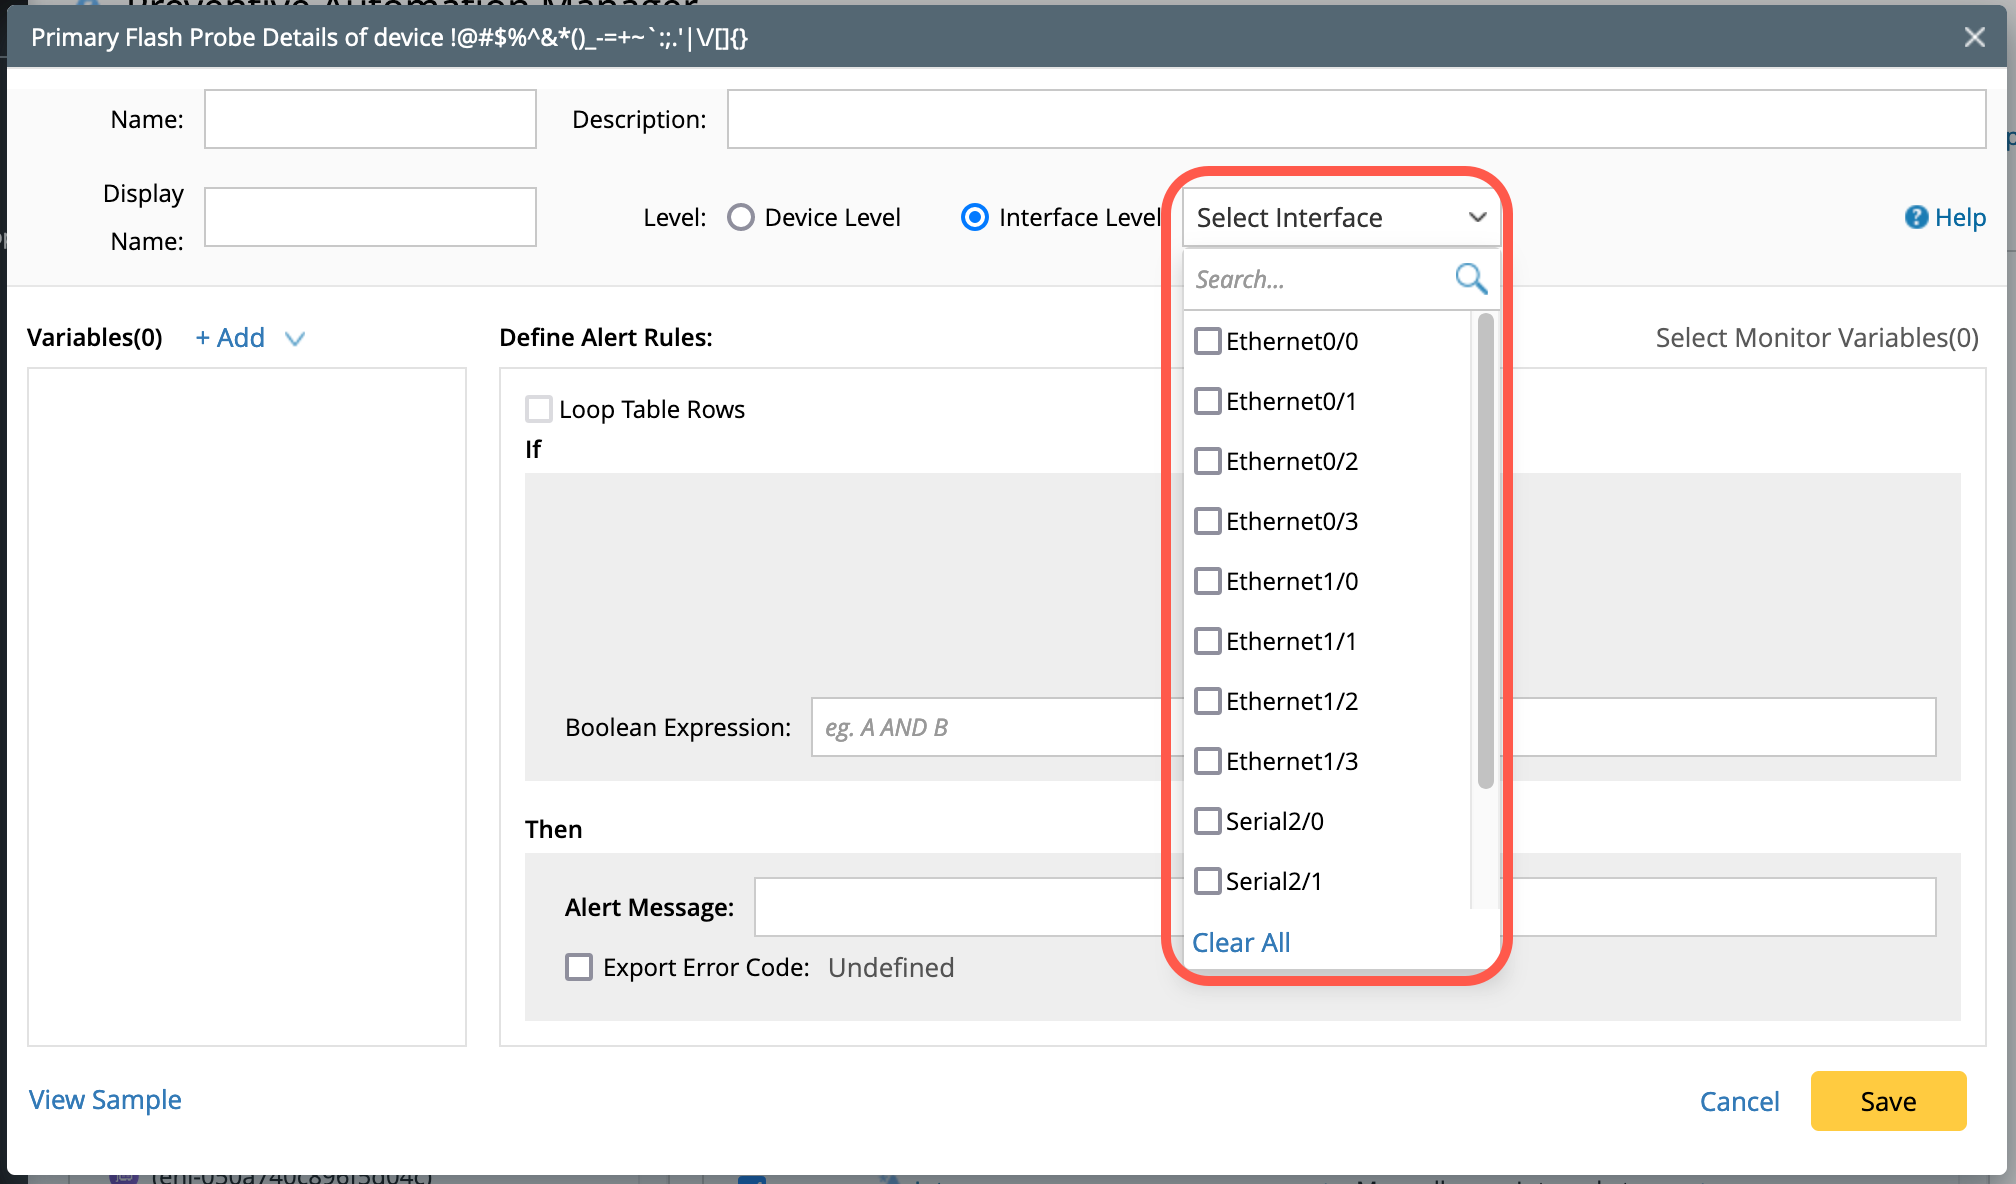
To capture interface-level anomalies, such as interface flapping and interface error increase, select Interface Level and then the interfaces from the drop-down menu.
A flash probe can be configured at multiple interfaces of the same device and in such case, the system will check all selected interfaces. If an anomaly exists in any of the selected interfaces, an alert will be generated, and respective NIs will be triggered.
-
To capture device-level anomalies, such as CPU high, device config change, and BGP neighbor flapping, select Device Level.
-
To define the variables that need to be monitored, click +Add to add variables.
- When the level is set at Device Level: Choose Add Device Variable from the drop-down menu. Search the variable by the keyword (of the variable or command) and select the variables. Click OK.
- When the level is set at the Interface Level: Select Add Device Variable or Add Interface Variable from the drop-down. Search the variable by the keyword (of the variable or command) and select the variables. Click OK.
-
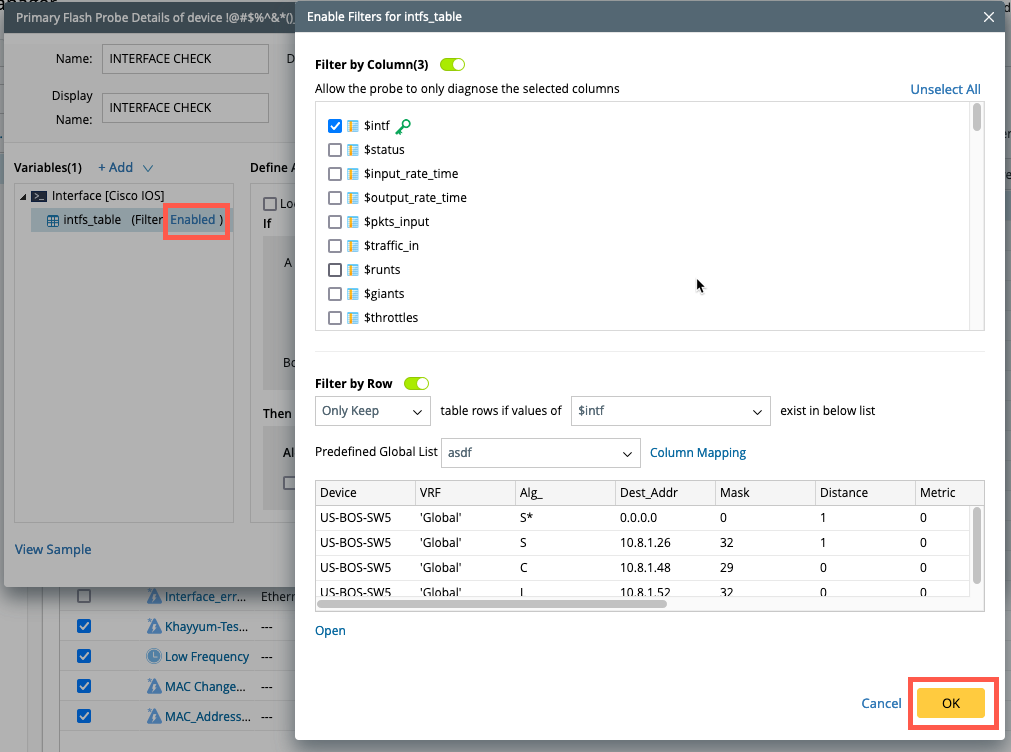
Upon adding the variable, you can click on the Disabled and filter the table row/column to keep only critical content.
-
Filter by Column: Enable the option and select the specific columns you want to diagnose with probe.
-
Filter by Row: Enable the option and use the ADT table as the source to filter the parser table. You can keep or remove certain rows to match with ADT table contents.

Note: This filter functionality is to define only table variables and not the single variables.
-
Filter by Column: Enable the option and select the specific columns you want to diagnose with probe.
- Click OK and you will find the Filter status next to variable changing to Enabled.
-
Define Alert Rules:
-
Loop Table Rows: Enable the check box and select Table Variable and then Table key. The table key compares the table rows against baseline/last values to identify unique rows.
Note: This functionality is enabled only for table variables and disabled for single variables. 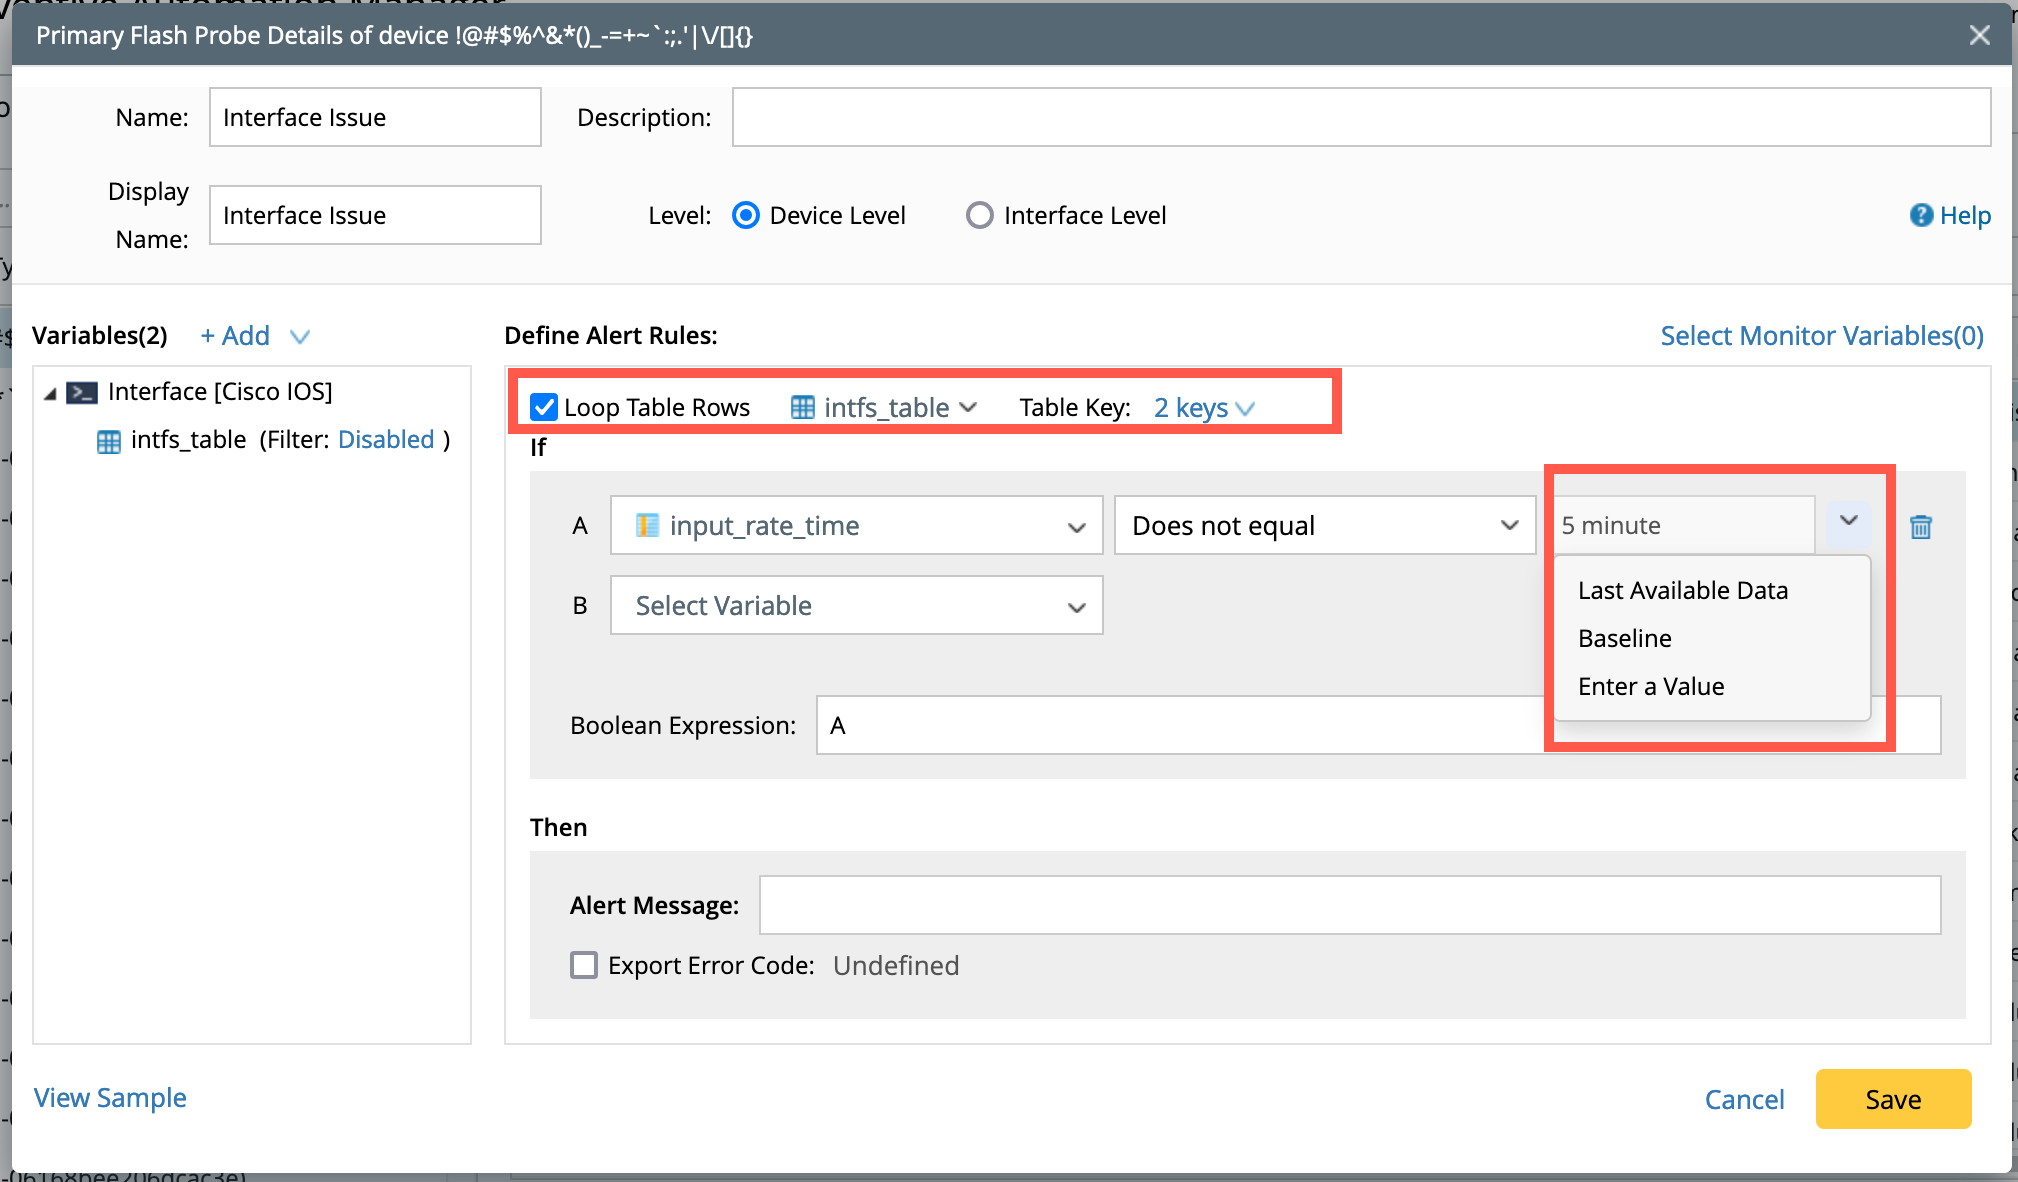
-
IF condition: Compare the variables using a condition, for example: If Does not equal operand is chosen, the options would be:
- Last Available Data: To compare the table data with its last available information, select Last Available Data.
- Baseline: The current data will be compared with data retrieved for the first time which is a baseline data.
- Enter a Value: Manually define the value, for example select a variable (input_rate_time), condition (Does not equal) and enter a value such as 5 minutes.
-
Loop Table Rows: Enable the check box and select Table Variable and then Table key. The table key compares the table rows against baseline/last values to identify unique rows.
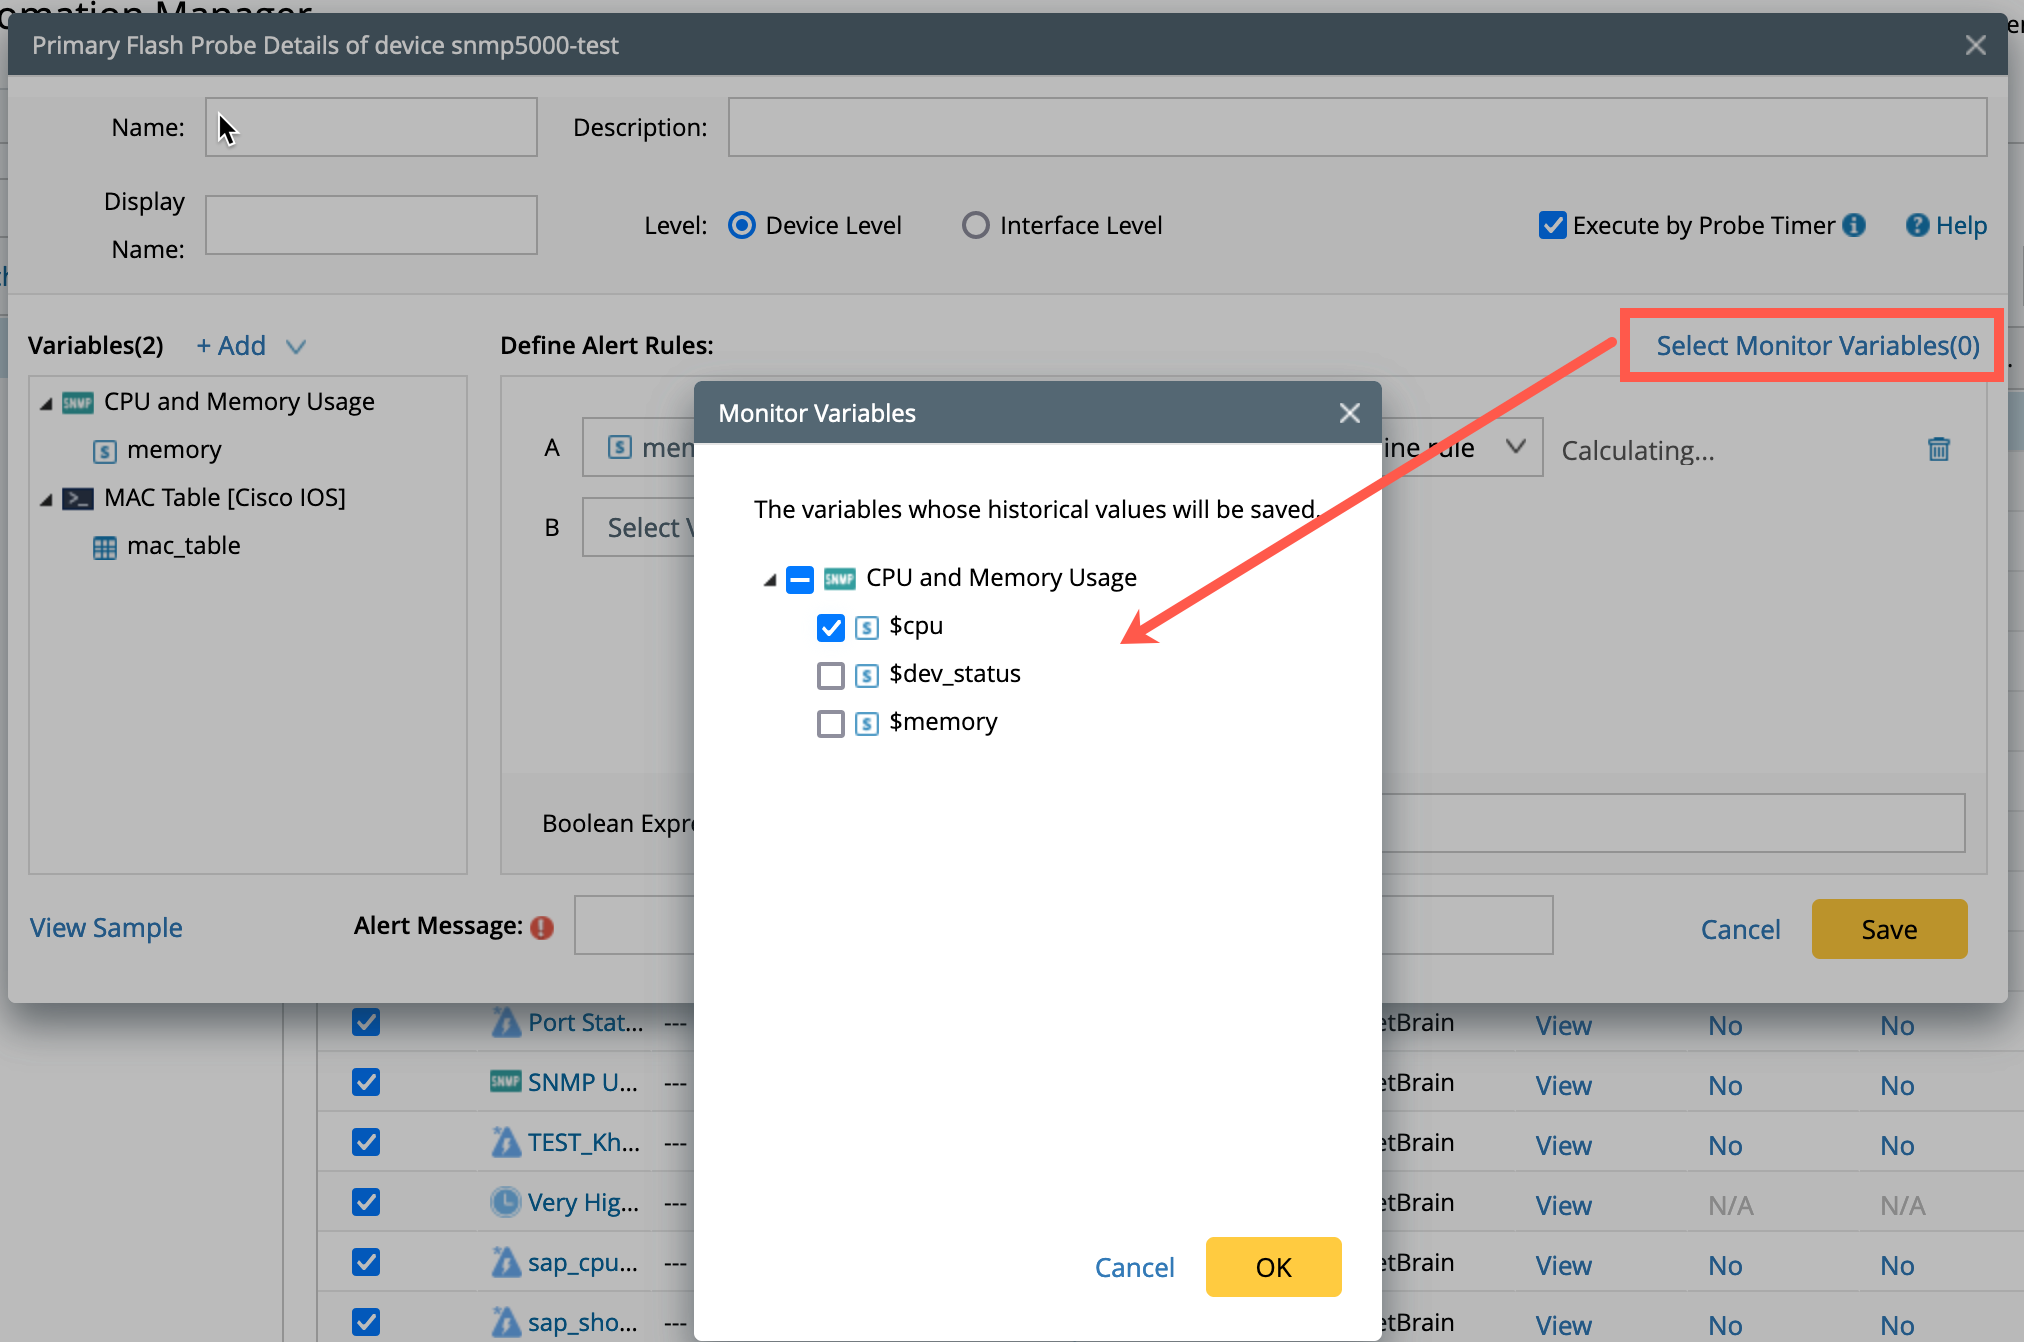
- Select Monitor Variable: If you wish to save the historical data for essential variables, click Select Monitor Variables and select the variables. The historical data will be saved in Monitor Data View.
-
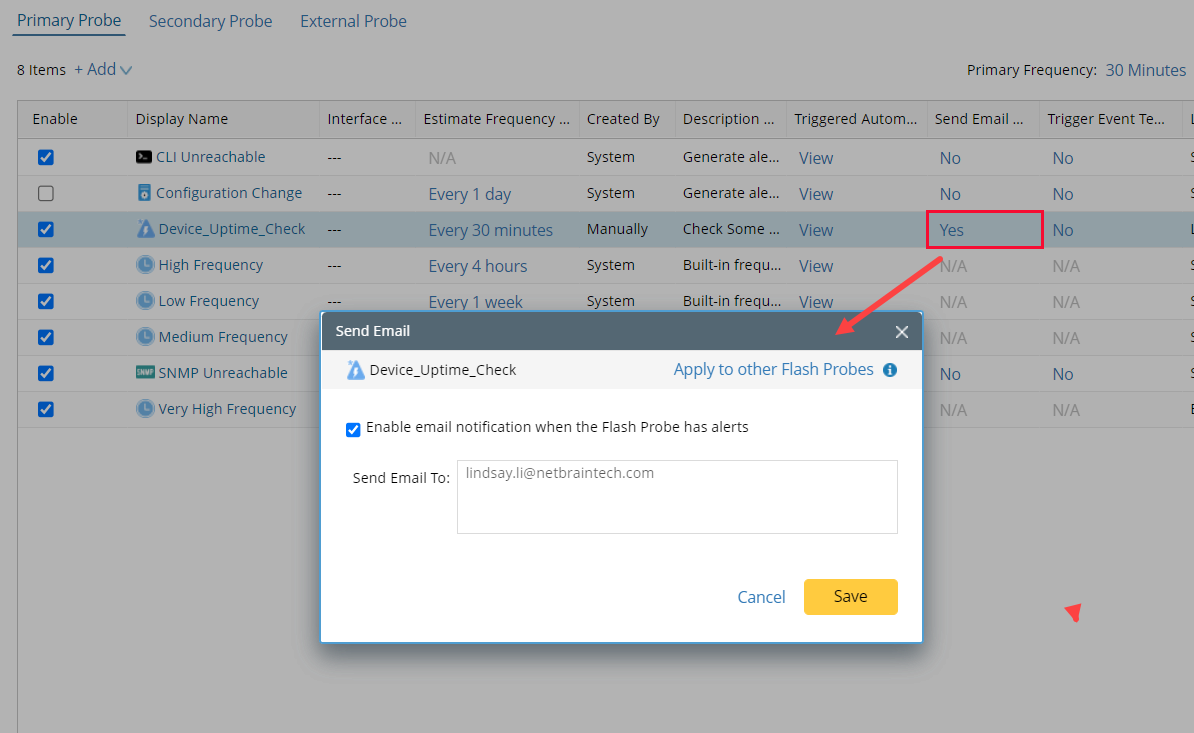
Enter the Alert Message:
The alert message will be displayed in the Execution Tree and can be sent via email for notification purposes. In the alert message field, you can type $ to reference the variables defined in the alert rule statement. See Viewing and Understanding Execution Tree for more details.

- Export Error Code: You can export the alert contents via the Error Code. The new error code column can be defined from the table or a single value used in the If condition as follows:
- Enable the Export Error Code option using the check box and click on Undefined to open the popup window Export Data to Error code.
- Click on +Add and you will find options to add a new column or append column from ADT/Function.
- Select New Column and:
- Append column via ADT Table/Function:
- Enter the Column Name and click OK.
- Select a variable either this_device or any of the single variable from the current device and click OK.
- Enter the Column Display Name.
- Select either ADT Table or Function under Append From.
- ADT table: Select an ADT table from the drop-down menu and add a column by looking up values from the ADT. The values from the Lookup column that match the Error code Column will be added to the error code.
-
Append column via Function: Function calls can be used to append the table column data. The following functions are supported:
- GetSubnet: Get the subnet information of the IP address.
- GetSite: Get the leaf site information of a device.
- IPToHostname: Convert an IP address to the hostname.
- IPToInterfaceName: Obtain a device interface full name by using a given IP address.
- InterfaceShortToFull: Obtain a interface full name by using a given interface short name.
- PercentageToNumber: Convert a percentage as a text to a float number.
- TrimRight: Trim one or more characters on the right side of a given string.
- TrimLeft: Trim one or more characters on the left side of a given string.
- Replace: Replace one character with another in a given string.
- FormatMAC: Get format MAC address that using NetBrain-specific standard (period-separated hexadecimal notation).

-
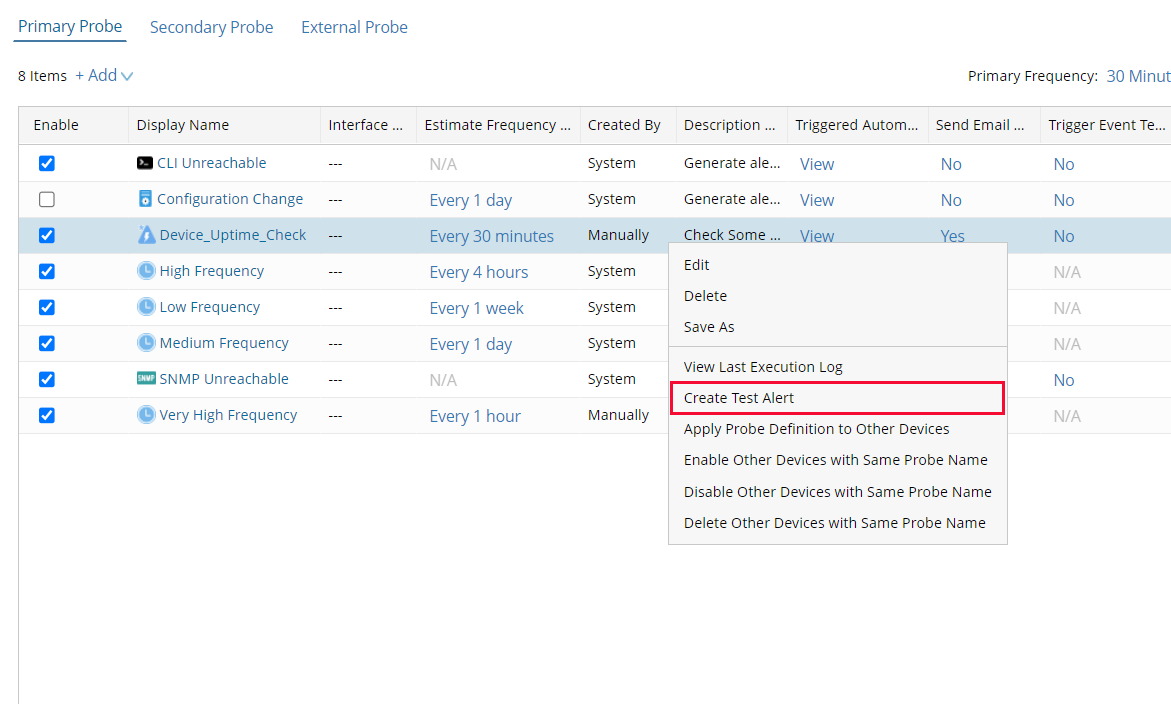
Test the Alert message:
Without executing the flash probe in a real network environment, you can have the system send you a test alert to see if this function works properly. The test alert is only in the Execution Tree as well. See Viewing and Understanding Execution Tree for more details.

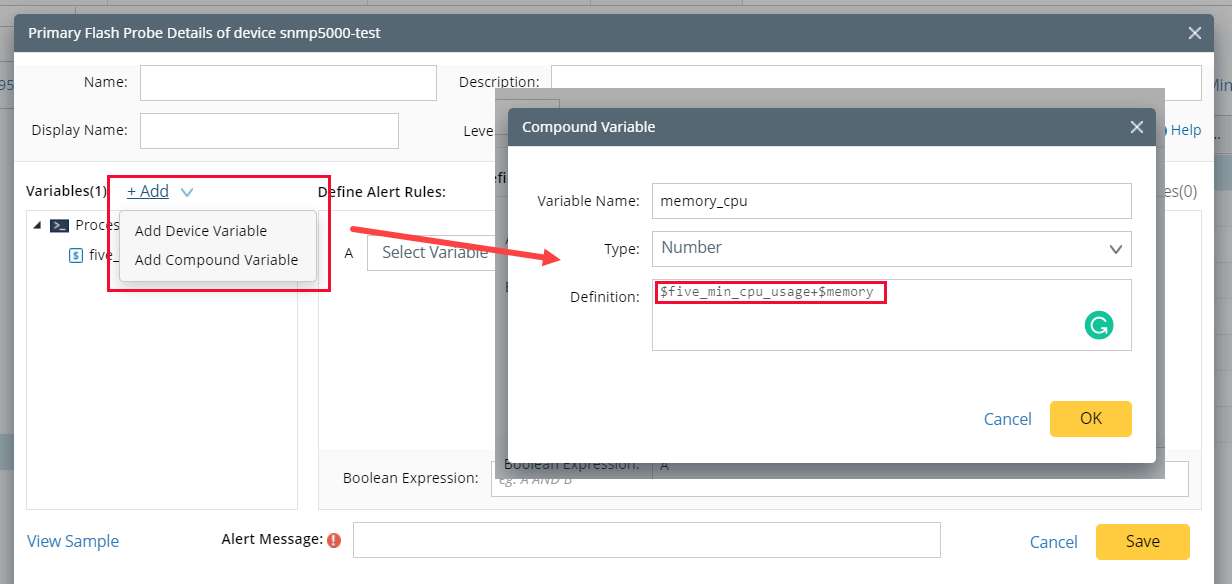
Once a variable is added, you can choose Add Compound Variable from the drop-down menu.

Once a variable is added, you can also choose Add Compound Variable from the drop-down.

|
|
Note: If a flash probe includes multiple interfaces, all the interfaces will use the same value for the parameter to retrieve the data. |
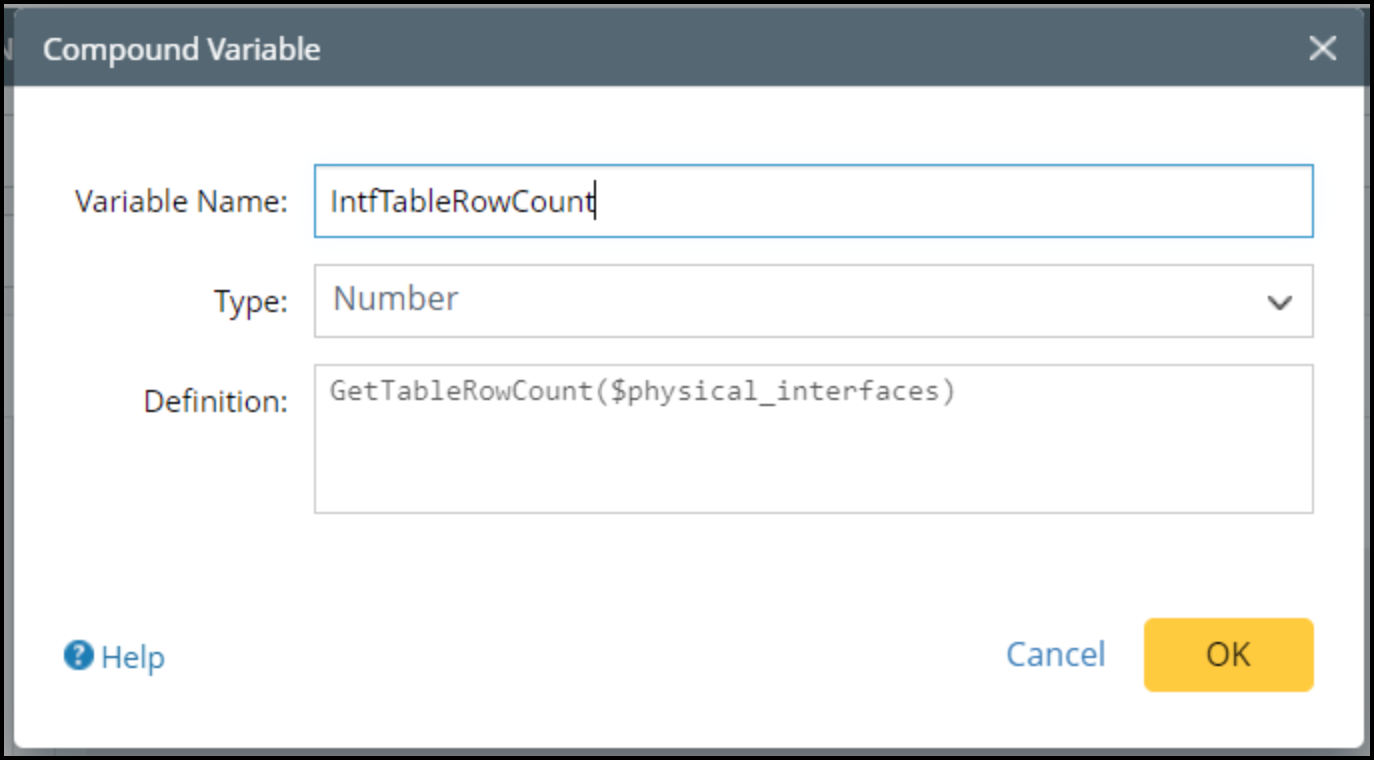
Compound variables are designed to perform bulk operations on multiple parser variables or use function calls to retrieve a certain value.
|
Example: IntfTableRowCount = GetTableRowCount($physical_interfaces)
|

|
|
Note: Not all defined variables can be referenced in the alert message field. Table variables and compound variables used in alert rule definition cannot be referenced. |

|
|
Note: Choosing this_device is very much useful when you have multiple looking glass devices and want to define match conditions based on looking glass devices. |


|
|