Monitoring Server and Service Metrics

Contents
Note: The Service Monitor Agent must be installed on the servers that you want to monitor. If you deploy more than one system across multiple data centers, you will have more than one Service Monitor portal.
To monitor server and service metrics:
1.In the System Management page, click Operations > Service Monitor from the quick access toolbar.
2.In the Service Monitor home Page, you can monitor key server metrics, server connectivity, resource utilization, service status and so on.
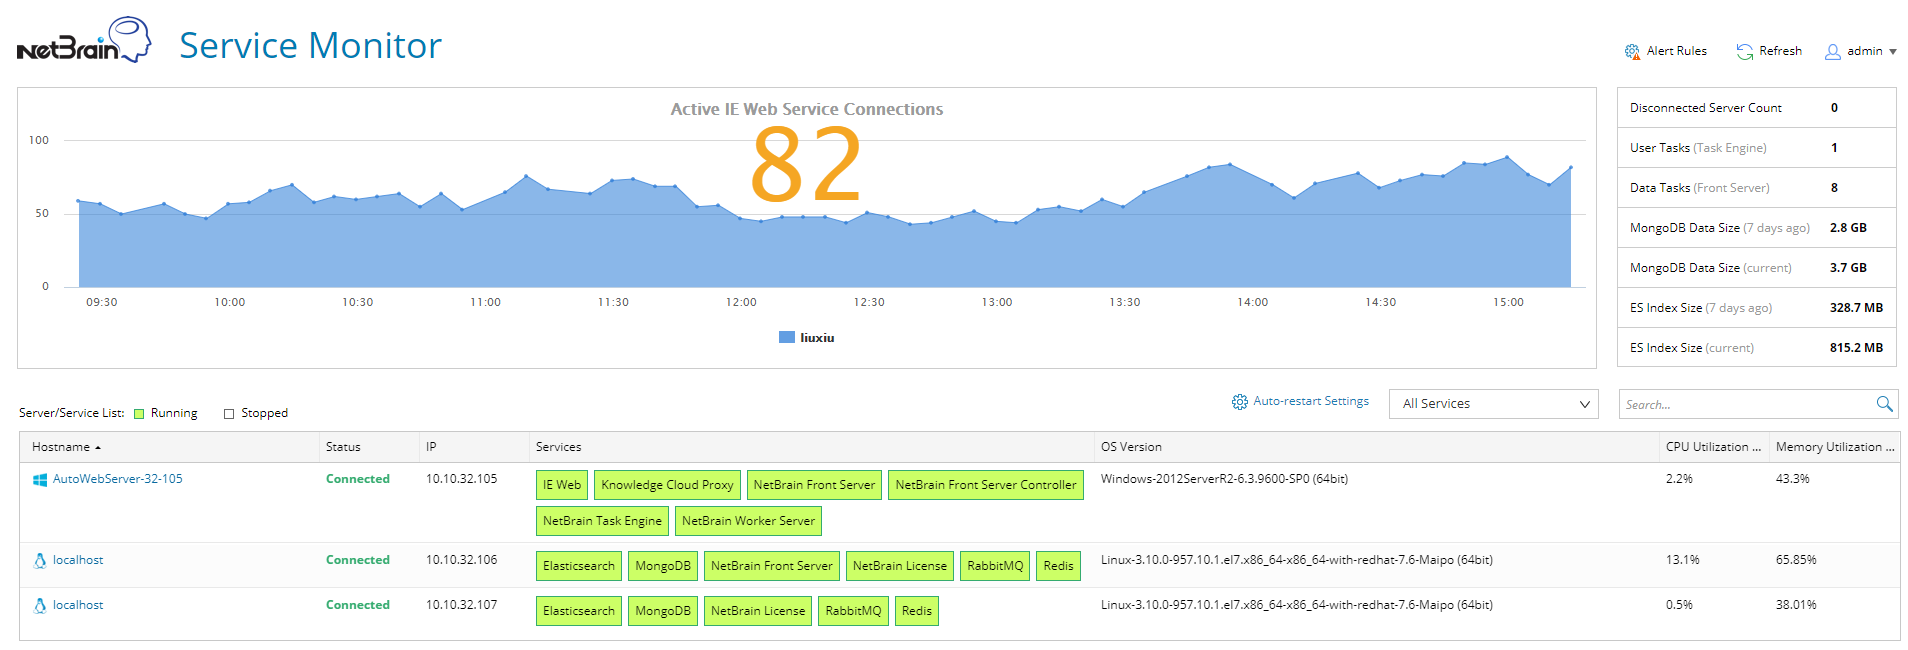
3.Customize the conditions for when to send out alert emails and take more actions for low disk space on MongoDB by clicking Alert Rules. See Managing Alert Rules for more details.
4.To check detailed metrics for a specific service, click the service name to view details. See Service Metrics for more reference. By default, the system collects metric data every 5 minutes and refresh the page every 5 minutes to display the latest metric data.

See also: