Defining Analysis and Output

Contents
Through the above steps, you have obtained the required data for the devices that you are interested in. Now you can define analysis and output the analysis results based on the retrieved data through the following two steps.
1. Defining the conditions to trigger result outputs
1)Point to the Table node, click the  icon, select Basic Output and click Extend.
2)Click the Output1 node, click New Condition to define a condition, such as $version contain 12.
The number is only for demo purpose, you can customize it.
Tip: The condition means that if the IOS version of the device contains 12, the Qapp will output the defined actions, such as highlight and drawing a map. You can also keep the default condition, which means that the Qapp will always output the defined actions.
2. Defining the actions (outputs) for the conditions
Example: Draw the devices with IOS version containing 12 on a map and highlight their IOS versions on the map.
1)Point to the Output1 node, click the icon, select Highlight Map from the Action Node drop-down menu and click Extend.
2)Define the Highlight Device node as follows:
a)Select the device that you want to highlight from the drop-down list. In this sample case, select $_device.
b)In the Legend field, enter the text for the color legend on the map, such as $version.
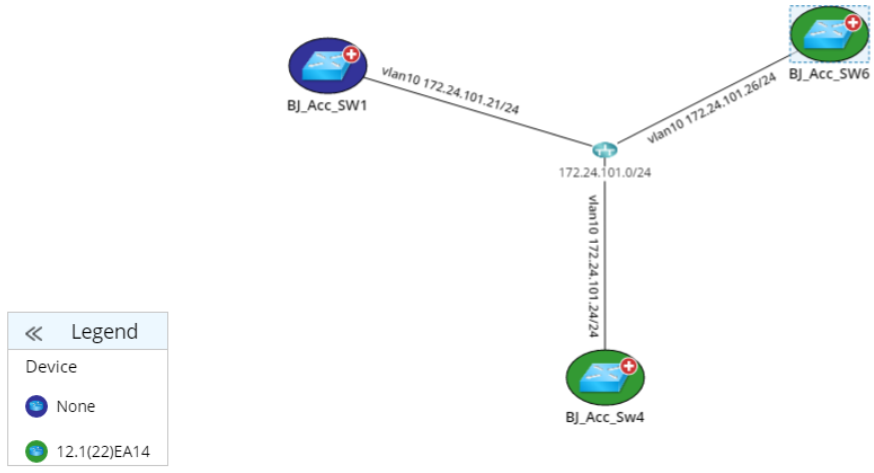
3)Save the Qapp and run it on a map. A sample result is as follows: