Searching for CLI Commands and Mapping Matched Results

Contents
Example: Search for the show interface command to display and monitor related data.
1.On the map page, click Actions > Instant Qapp on the map toolbar.
2.In the search bar, enter the show interface command keyword and press the Enter key.

The supported keywords in Instant Qapp include:
▪CLI Command: show ip interface, show process cpu, and so on.
▪Network Term: bgp, ospf, and so on.
▪Network Parameter: cpu, mtu, and so on.
Note: If you add or delete devices on the target map, you must manually refresh the search results.
Tip: The recently used keywords and search results are recorded in the map search bar for reuse. Each keyword and data source is allocated with a different weight, and the search results are ranked by weight.
3.Click the intfs_table table to expand it.
4.Check the circles at the upper-right corner to select multiple variables.
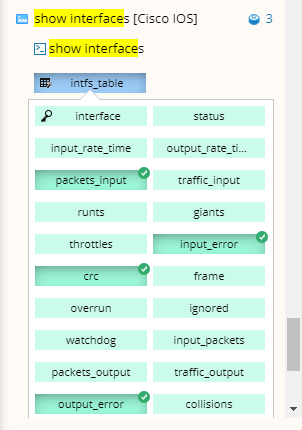
5.Drag the selected variables to the map. The system starts to retrieve live data, and the results are displayed on the map.

6.Select the input_error variable on the Control Panel and define an alert condition for it.

7.Click the Data Source field to select Pull live data regularly, specify the frequency, and then click OK.

8.Click Run to monitor these variables periodically. When the value of the input_error variable of an interface reaches the threshold, the variable will be highlighted on the map.

Tip: To save the variables and alert conditions as a new Qapp, click the ![]() icon and select Save as Qapp.
icon and select Save as Qapp.
Tip: Click Show Output Console to view the alert details and more other information.
See also: