Incident Portal

Contents
Incident Portal, independent of the NetBrain Workstation, is a web portal for an incident, while it still has a connection by syncing the information about collaboration sessions.

Create an Incident to Enable Portal
You can conveniently enable an incident portal when a new incident is created, without opening another dialog.

In the New Incident dialog, you can select the Enable Incident Portal check box, set the access code, then click Save to enable the incident portal.
After the settings for creating a new incident and enabling an incident portal are saved, a system message with a link to the incident portal is automatically generated and published to the message pane in the IE Workstation.

With this system message, you can do the following actions:
▪Navigate to the incident portal: Directly click the portal URL to navigate to the incident portal.
▪Open advanced settings: Click Change Portal Setting to open the Advanced Settings dialog.
▪Copy the portal URL: Click Copy URL to copy the portal URL.
Note: This system message is only displayed in the incident pane, but not in the incident portal.
Messages
Compared with NetBrain Workstation, the incident portal only supports four advanced actions for posting messages: rich text, mention user, attachment, and URL link. The behavior of each action is the same.
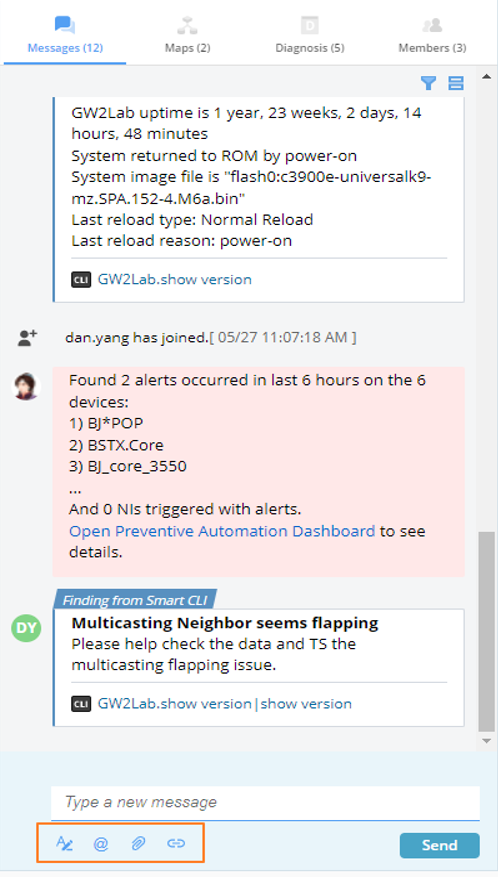
Note: The map links, runbook links, and device data links on the portal are view-only, but not the hyperlinks.
Data View Visibility
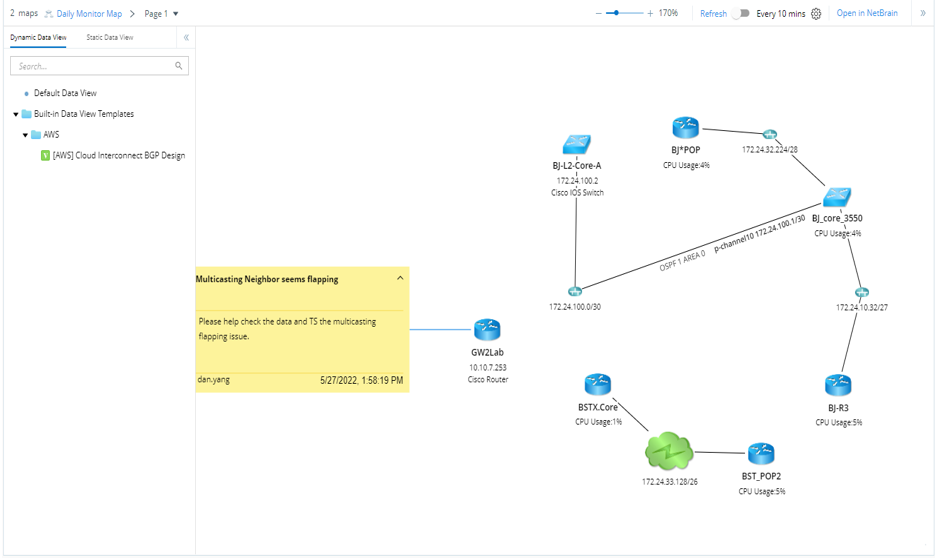
The data view visibility is configurable for an incident portal. You can select the Allow users to switch Data Views check box in Advanced Settings to display all the matched data views or only the selected data views for portal users.

▪No Data Views: If the check box is not selected, the data view pane will not be displayed on the portal map.

▪All Data Views: Display all the matched data views on the portal page.
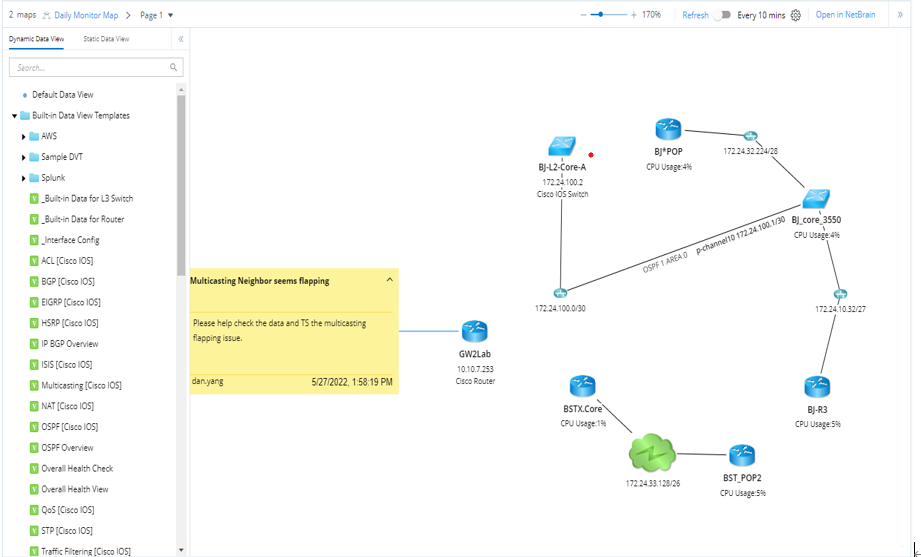
▪Selected Data Views: Display the selected data views on the portal page.
Note: All the data views listed in portal are qualified based on the map devices.
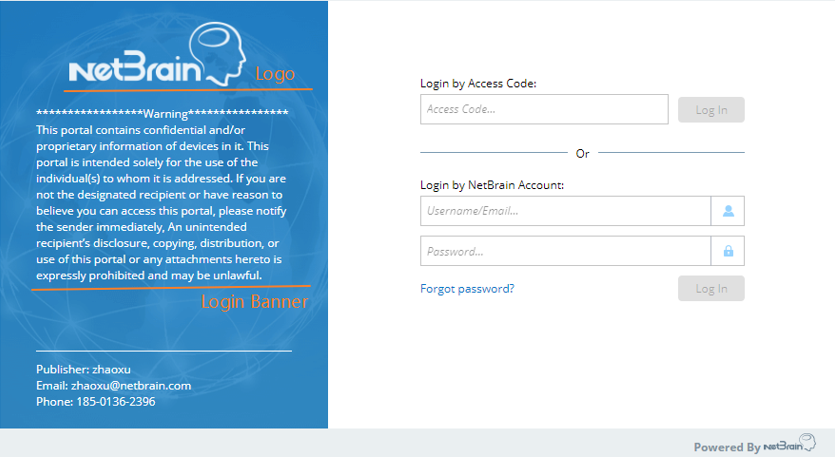
Log In
▪NetBrain users can log in to the Incident Portal with NetBrain credentials.
▪External users can log in to the Incident Portal with an access code.

Note: Logging in with an access code defaults to a read-only mode in the Incident Portal. However, you can create a user profile for further operations on the portal. Still, your profile name and password cannot be used for portal login, but only for user authentication after login.

Two Modes for an Incident Portal (New Feature in V10.1.1)
The system provides a full mode and a concise mode for an incident portal. Portal mode is configurable in the Advanced Settings dialog. In the Advanced Settings dialog, you can select the check box of a desired portal mode and click Save to set the portal mode for portal users.
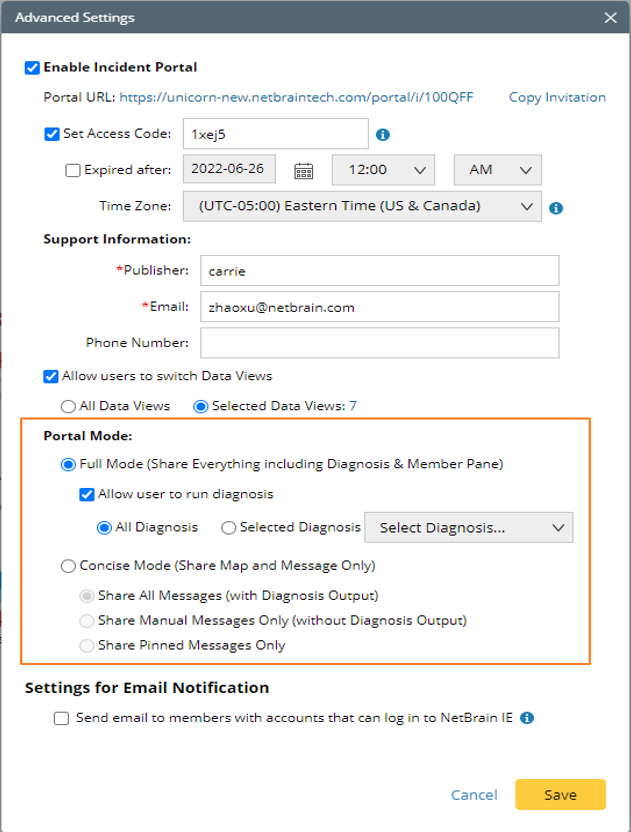
▪Full mode
An incident portal also has all the four key elements as in an IE incident, which are as follows: Messages, Maps, Diagnosis, and Members. An incident portal in the full mode has all the four tabs displayed and all the features of the incident portal are enabled. You can view maps and post messages, etc. in the full mode.

▪Concise mode
In the concise mode, only the Messages tab is displayed to simplify the incident portal, and the contents displayed in the incident portal are under the control of portal owners. In the concise mode, messages posted by portal users are constantly visible in both the IE Workstation and the incident portal.
In the concise mode, three options are further provided for configuring what types of messages are displayed in the incident portal.
oShare All Messages (with diagnosis output) (default mode): Share all messages, including messages automatically generated from TAF (Triggered Automation Framework), subscribed PA (Preventive Automation), and manually-run diagnosis.
oShare Manual Messages (without diagnosis output): Share all messages except automatically generated messages (diagnosis output), the automatically generated messages including messages generated from TAF, subscribed PA, and manually-run diagnosis.
oShare Pinned Messages Only: Share only pinned messages. All the pinned messages (including automatically generated messages that are pinned) are displayed in the message pane of the portal.
Note: The data view visibility can be configured in both the concise mode and the full mode.
▪Setting Portal Mode in the TAF system
To set portal mode in the TAF system, go to Triggered Diagnosis Center > Incident Type > New Incident Type to configure the incident portal mode in the TAF system.

In the TAF system, you can check a box to select a portal mode and click Save to set the portal mode for portal users.
The three options of portal mode provided in the TAF system are as follows:
oFull Mode: Share everything, including Diagnosis pane and Members pane.
oConcise Mode with Diagnosis Output (default mode): Share all messages, including messages automatically generated from TAF, subscribed PA, and manually-run diagnosis.
oConcise Mode without Diagnosis Output: Share all messages except automatically generated messages (diagnosis output), the automatically generated messages including messages generated from TAF, subscribed PA, and manually-run diagnosis.
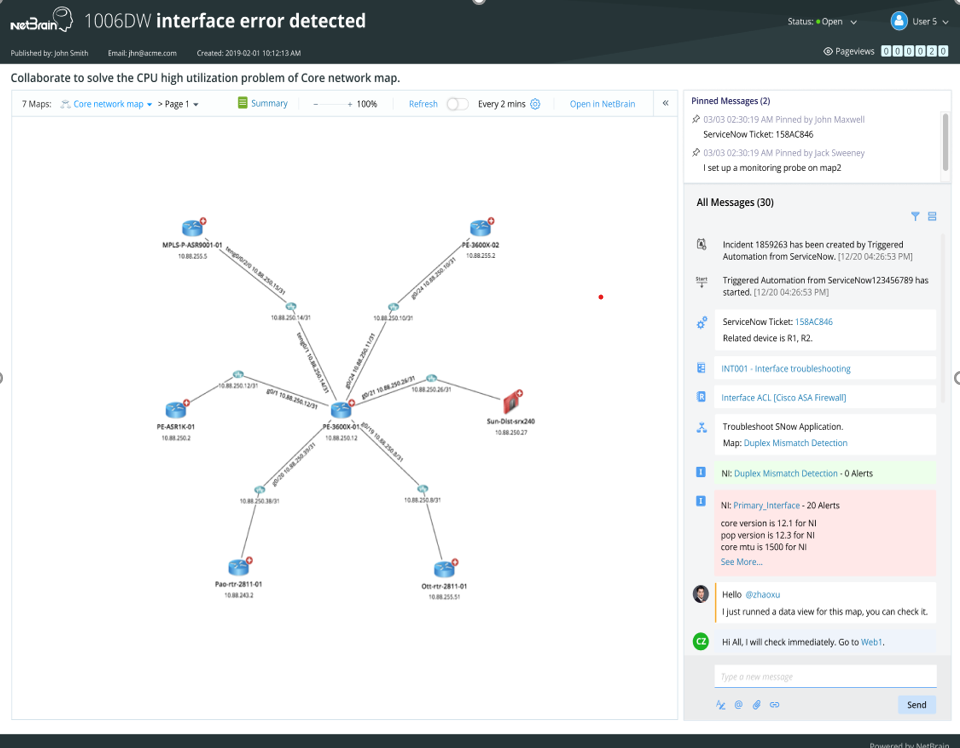
Customize Style of Incident Portal
The system allows you to customize the style of Incident Portals within a domain, such as page template, customized logo, and the banner on the login page, etc.
The system provides two style templates:
▪Web Style Template (Default One):

▪Tool Style Template
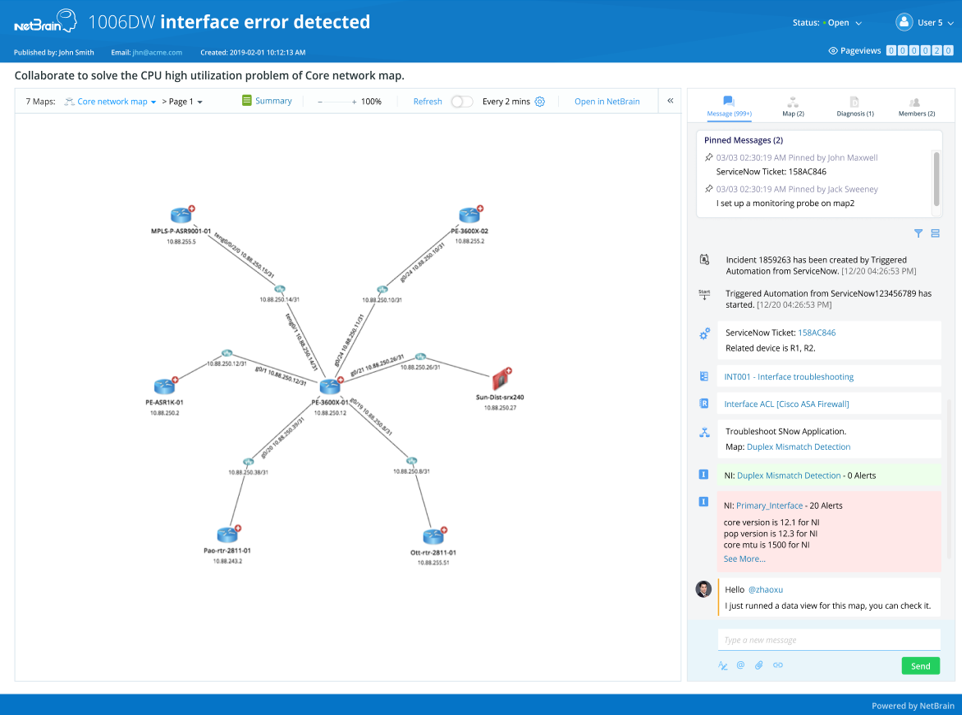
To customize the style of Incident Portals within a domain, go to Domain Management > Domain Settings > Incident Portal Layout Settings. All the portals in a domain will share the same portal style.
Differences between Incident in Workstation and Portal
The functions of the posted message, relevant maps, and members have some differences compared with those in NetBrain Workstation in the following aspects:
Feature |
Sub-feature |
Is in NetBrain Workstation |
Is in Portal |
|---|---|---|---|
Message |
View/Post/Search/Edit/Delete Message |
√ |
√ |
Pin/Unpin Messages |
√ |
|
|
Switch message mode |
√ |
√ |
|
Rich Text, @user, upload an attachment, and insert URL link |
√ |
√ |
|
Insert and view #deviceData |
√ |
|
|
Insert the map link and open it in the NetBrain workstation |
√ |
|
|
Insert the runbook link and open it in the NetBrain workstation |
√ |
|
|
Map |
Drag (move) Device, Zoom In and Zoom Out, Apply DVT/Static DV with Baseline Data |
√ |
√ |
Switch Associated Map |
√ |
√ |
|
Edit/Save/Export Map, Live Run DVT, Manage Map Data View, View Date, View Historical Data, Runbook Right-click Menu of Device and Map Level (View Device Data, Create Note, Change Map Layout, and so on) |
√ |
|
|
Add Map to Incident, Remove Map from Incident |
√ |
|
|
Request Map Editing Rights |
√ |
|
|
Diagnosis |
Run Self-service Diagnosis |
√ |
√ |
Query Alerts from Preventive Automation |
√ |
|
|
Subscribe to Preventive Automation |
√ |
|
|
View Diagnosis Results |
√ |
√ |
|
Device |
Add/Edit/Delete Device Note |
√ |
√ |
Flag Device or Cancel Flag |
√ |
√ |
|
Add Device/Interfaces to Incident |
√ |
|
|
Add Device/Interfaces to Current Map |
√ |
|
|
Remove Devices/Interfaces from Incident |
√ |
|
|
Members |
Join/Leave |
√ |
√ |
Invite |
√ |
|
|
Enable/Disable Incident Portal Set Access Code |
√ |
|
|
General Operations |
Set Incident Status |
√ |
√ |
New/Edit Incident |
√ |
|
|
Associate/Switch Incident |
√ |
|
|
View/Edit Incident Properties |
√ |
|
|
Advanced Settings, Support Information Settings, Data View Settings, and Email Notification Settings |
√ |
|
|
Set portal mode |
√ |
|