Executing a Network Intent in Debug Mode

Contents
In Debug mode, the NI creator can run an NI step by step and check each step's input and output value. The system executes NI in four levels:
→ Device (level 1)
→ Section (level 2)
→ Diagnosis (level 3)
→ Condition Detail (level 4).

1.Open a map, and the related NIs are displayed.
2.Click an NI name to open an NI.
3.Click Edit and select Debug by clicking the  icon.
icon.

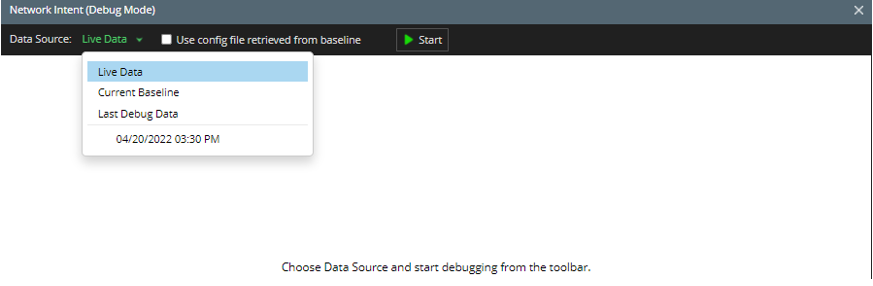
4.Click Start. The default data source is Live Data, you can also select Current Baseline or Last Debug Data from the drop-down list
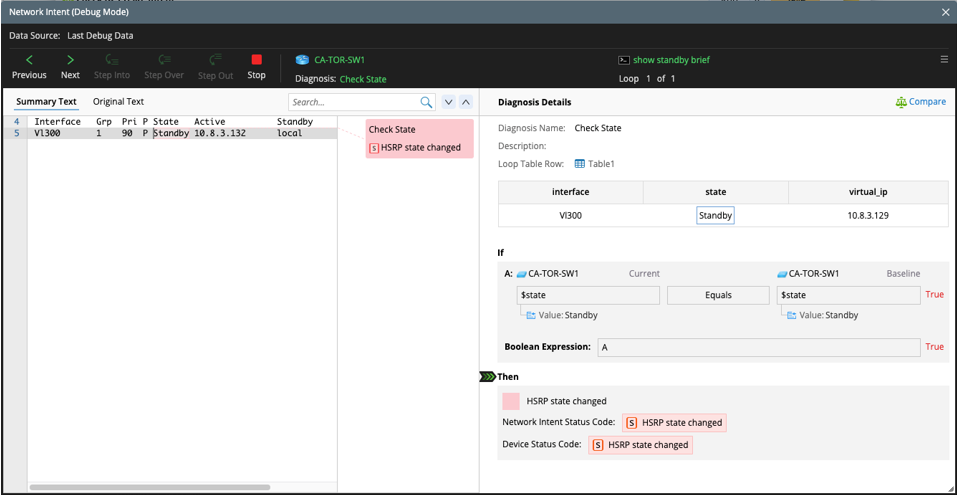
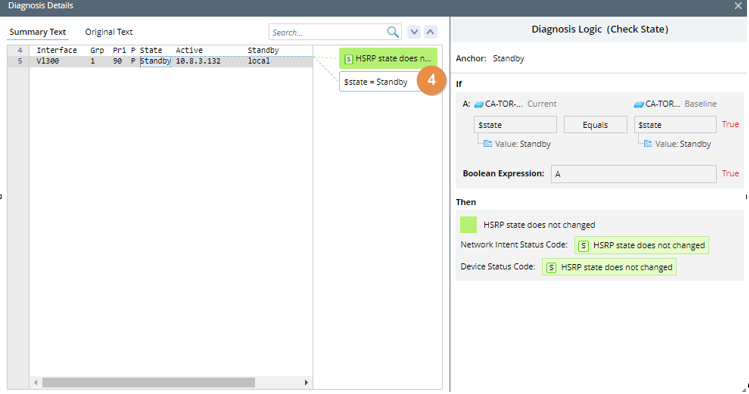
5.Use Debug control pane to view details step by step.
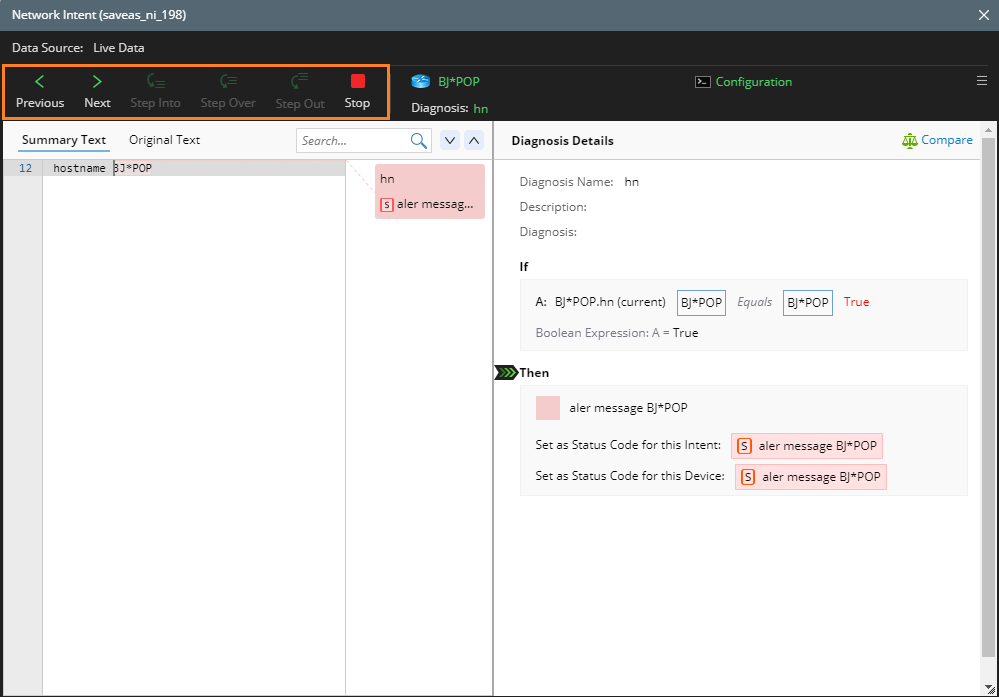
▪Previous: go to the previous node.
▪Next: goes to the next node.
▪Step Into: go to the node in the lower level.
▪Step Over: go to the next node in the same level.
▪Step Out: go to the next node at a higher level.
▪Stop: stop the debug mode.
6.Click Step Into to view the details. For the table/paragraph variable, each row of data is displayed in the Diagnosis Detail pane.