Viewing Diagnosis Tree (Post-Execution)

Contents
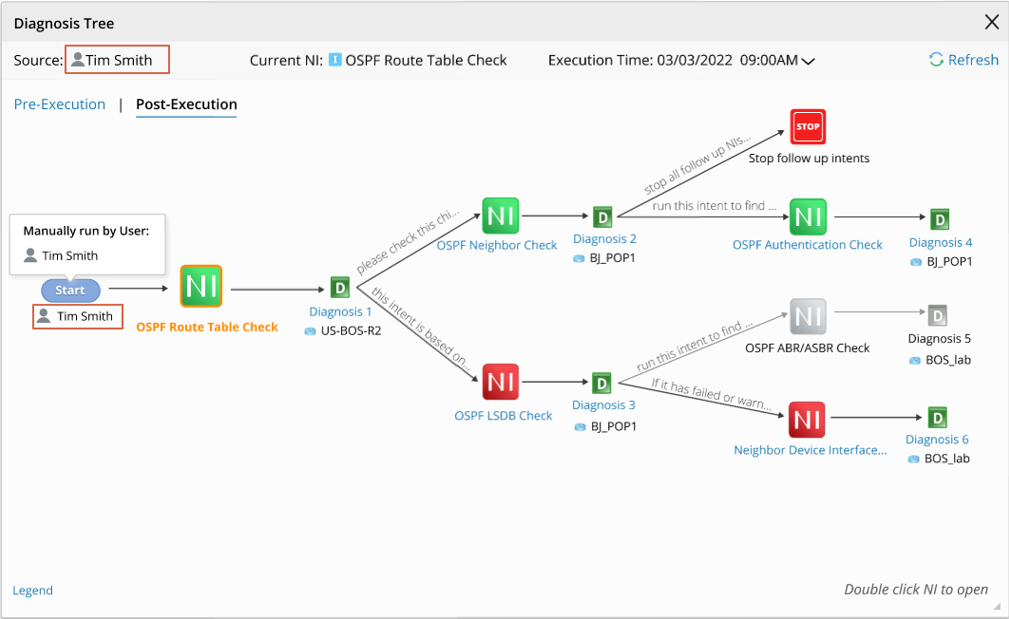
Diagnosis Tree (Post-Execution) shows the execution status of follow-up diagnosis based on the designed Diagnosis Tree (Pre-Execution). After a NI executed, you can view its Diagnosis Tree (Post-Execution), Each execution result at different time has its own independent Diagnosis Tree (Post-Execution).
The display of the Diagnosis Tree (Post-Execution) follows these rules:
▪Different execution states of NI nodes are marked with different colors.
oThe NI will be highlighted in red if executed with alerts generated.
oThe NI will be highlighted in green if executed with no alert generated or even if NI executes abnormally with no alert.
oThe NI will be highlighted in gray if not executed.
▪If the Diagnosis node is executed, it will be displayed as the executed state. Otherwise, it will be displayed as the unexecuted state. They will be highlighted with different colors respectively.
▪If the Stop node is reached, it will be displayed as the executed state. Otherwise, it will be displayed as the unexecuted state. They will be highlighted with different colors respectively.
▪If the upstream NI of the Diagnosis node is not executed, this diagnosis node will not be executed.
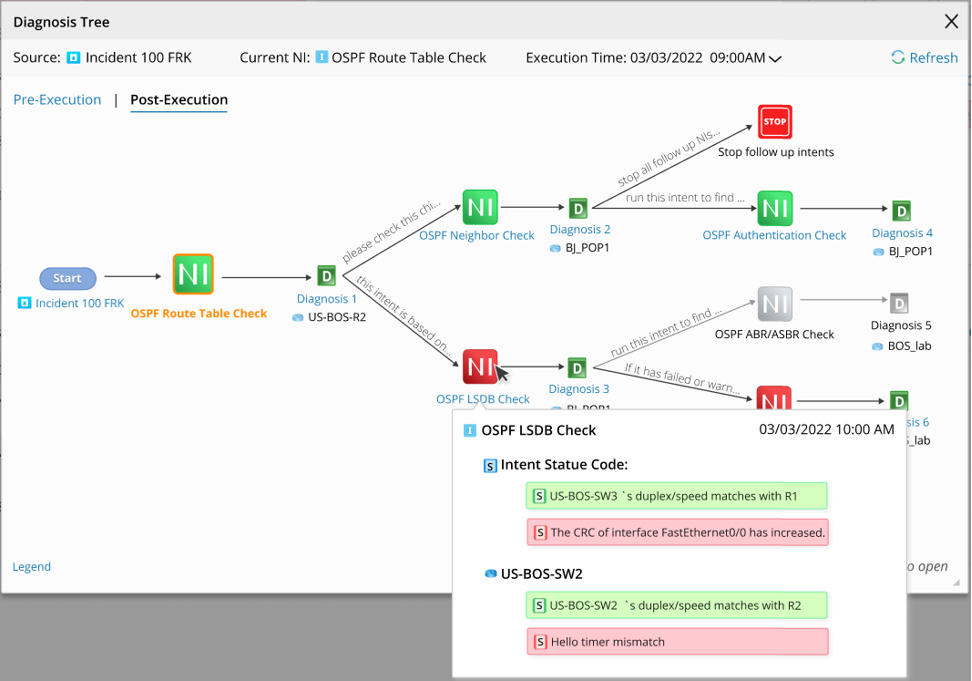
▪Hovering over an NI node will display the status code generated by the NI.
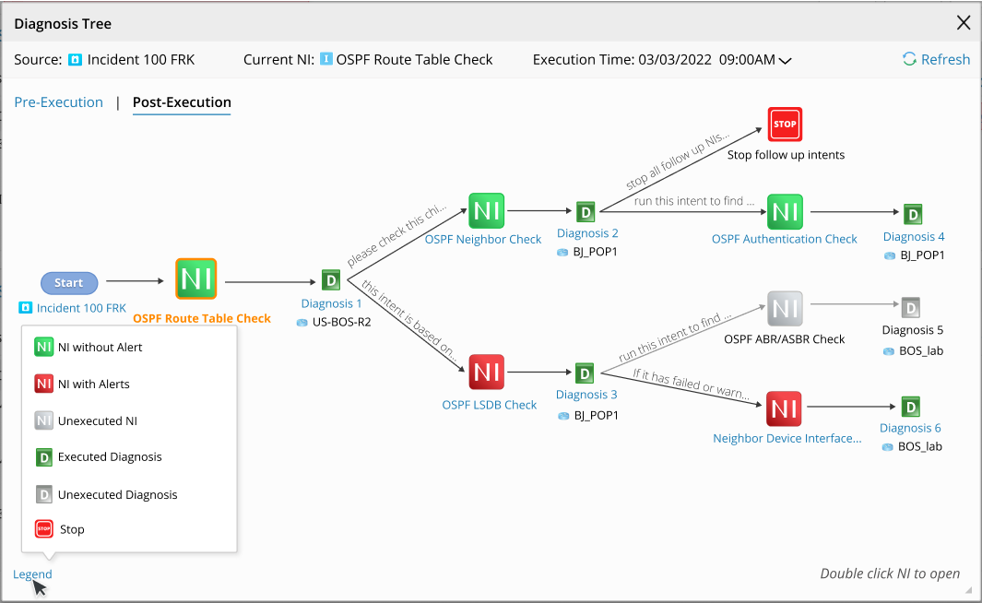
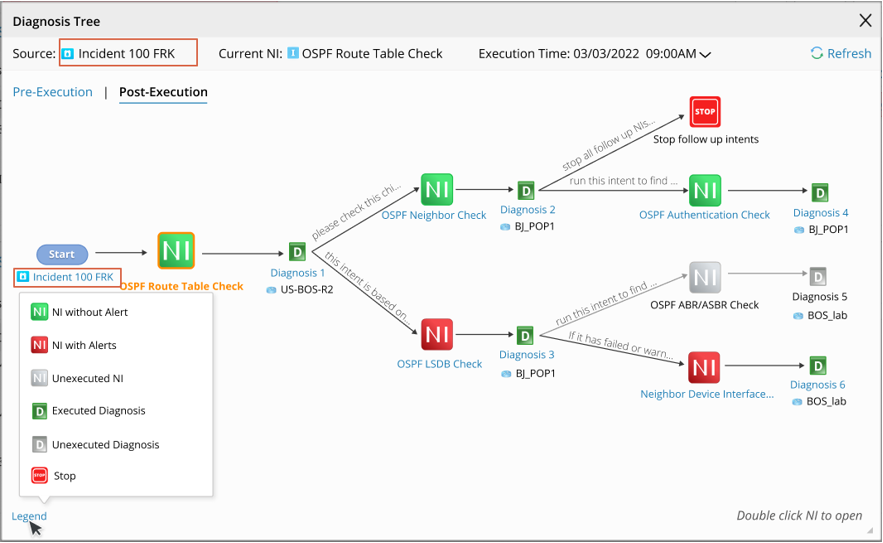
▪Hovering over the Legend will display 6 kinds of legends.
▪The source of the current NI result is displayed, which can be:
oThe incident ID if the NI is triggered by TAF. Clicking it can open the corresponding incident pane.
oThe device probe name if the NI is triggered by PAF. Clicking it to view the probe definition.

oThe username of the executor if NI is manually executed.