Diagnosis Tab

Contents
On the Diagnosis tab, you can query alerts from preventive automation, view NI results, and manually run the diagnosis.
Manually Run Diagnosis
You can run self-service Diagnoses defined in TAF both in IE Workstation and Portal.

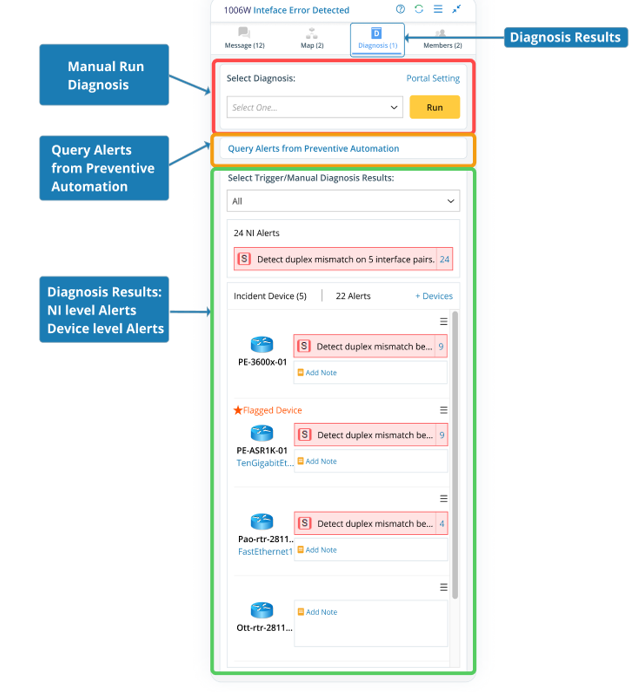
After the NI/NIC in Diagnosis is executed, the execution results will be sent to the incident message tab and the output of the diagnosis pane.
Query Alerts from Preventive Automation
You can query all alerts for incident devices or current map devices.

A query summary is displayed in the Incident Message pane, which links to the Preventive Automation Dashboard.

View NI results
After the NI/NIC in Diagnosis is executed, the execution results will be sent to the incident message and the diagnosis pane.
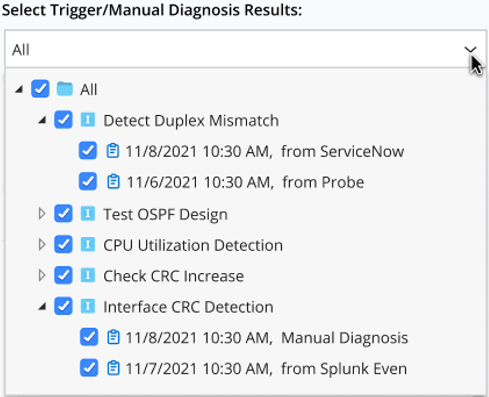
Under the Select Trigger/Manual Diagnosis Results drop-down list, the results from the below sources are displayed: Triggered Diagnosis (including Probe trigger NI) and Manually Run Diagnosis.
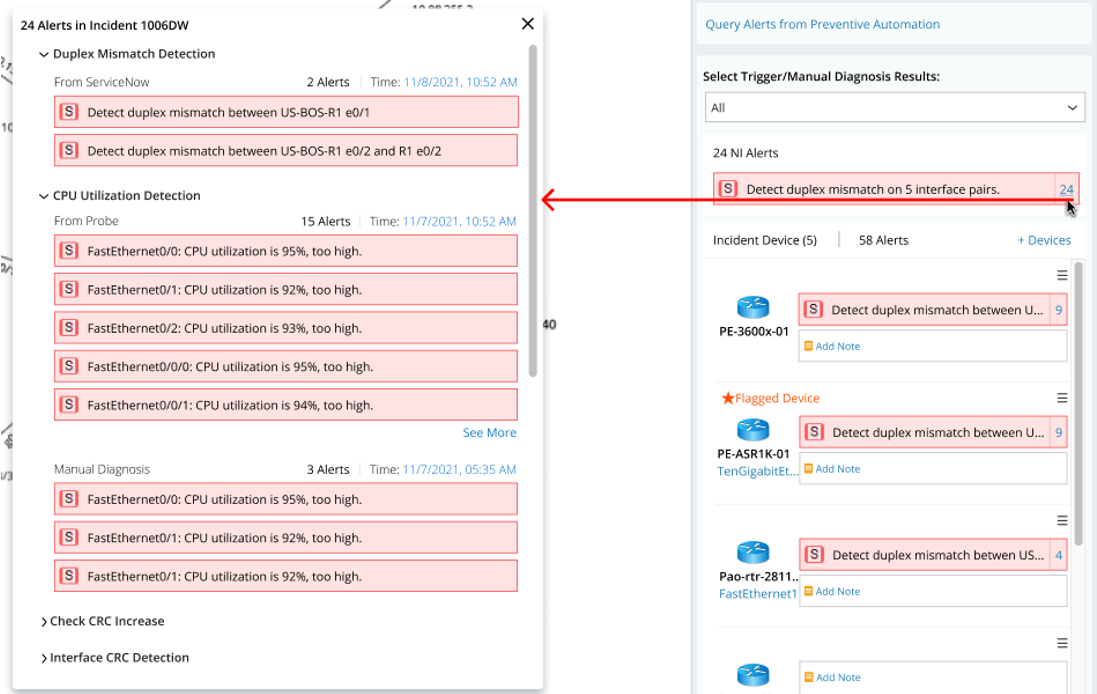
You can select the NIs to view NI-level alerts and device-level alerts generated on the incident device(s). Only one alert is displayed by default. However, you can click the number to see more.
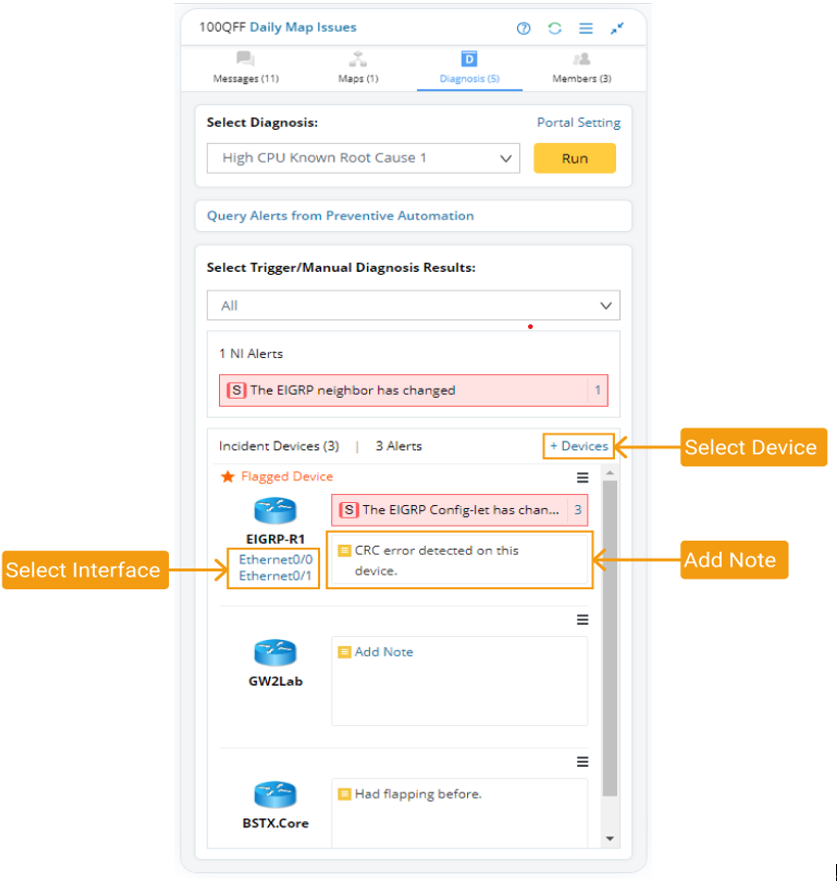
Incident Device
Adding relevant devices to the collaboration session enables all members to know the suspicious devices and interfaces or those involved in the troubleshooting. Each added device/interface can be annotated to share insights with members.