Defining Analysis and Alert

Contents
Through the above steps, the Canvas obtains the data that you are interested in. In this step, define analysis and output the analysis results. The Data View node is used to define how to periodically present the analysis result of the Qapp.
1.Point to the Table node, click the  icon to select Data View and click Extend.
2.At the Data View node, click Select Data UnitItems.
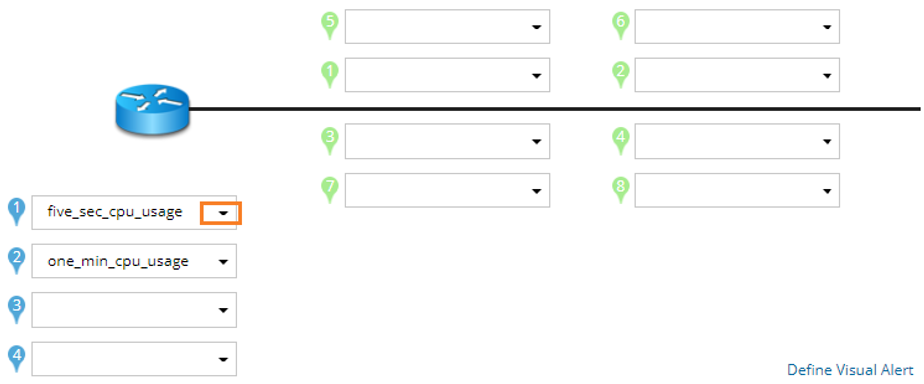
3.In the Select Data Unit dialog, select five_sec_cpu_usage and one_min_cpu_usage and then click OK.
4.Customize the display positions for these variables on a map.
5.Click the ![]() icon to define an alert condition for the five_sec_cpu_usage variable.
icon to define an alert condition for the five_sec_cpu_usage variable.
1)Enter a meaningful name for the alert, such as HighCPU.

2)Select Basic from the Type drop-down menu.
3)Select >= from the drop-down list and enter a value in the threshold field. [now] means the value of the current poll cycle, >= means larger than or equal, and [Threshold] means the limit value to trigger the alert.
4)Enter a message in the Then field. For example, the device is busy!.
5)Select an alert level. The color of a device varies from alert levels. If the Alert Level is Error, a device turns red; If Warning, a device turns yellow when the predefined threshold is reached.
Tip: You can define multiple alerts for a variable. For example, define an error alert when the CPU usage exceeds 90.

6)Click OK.