Use Map as a Single Pane of Glass
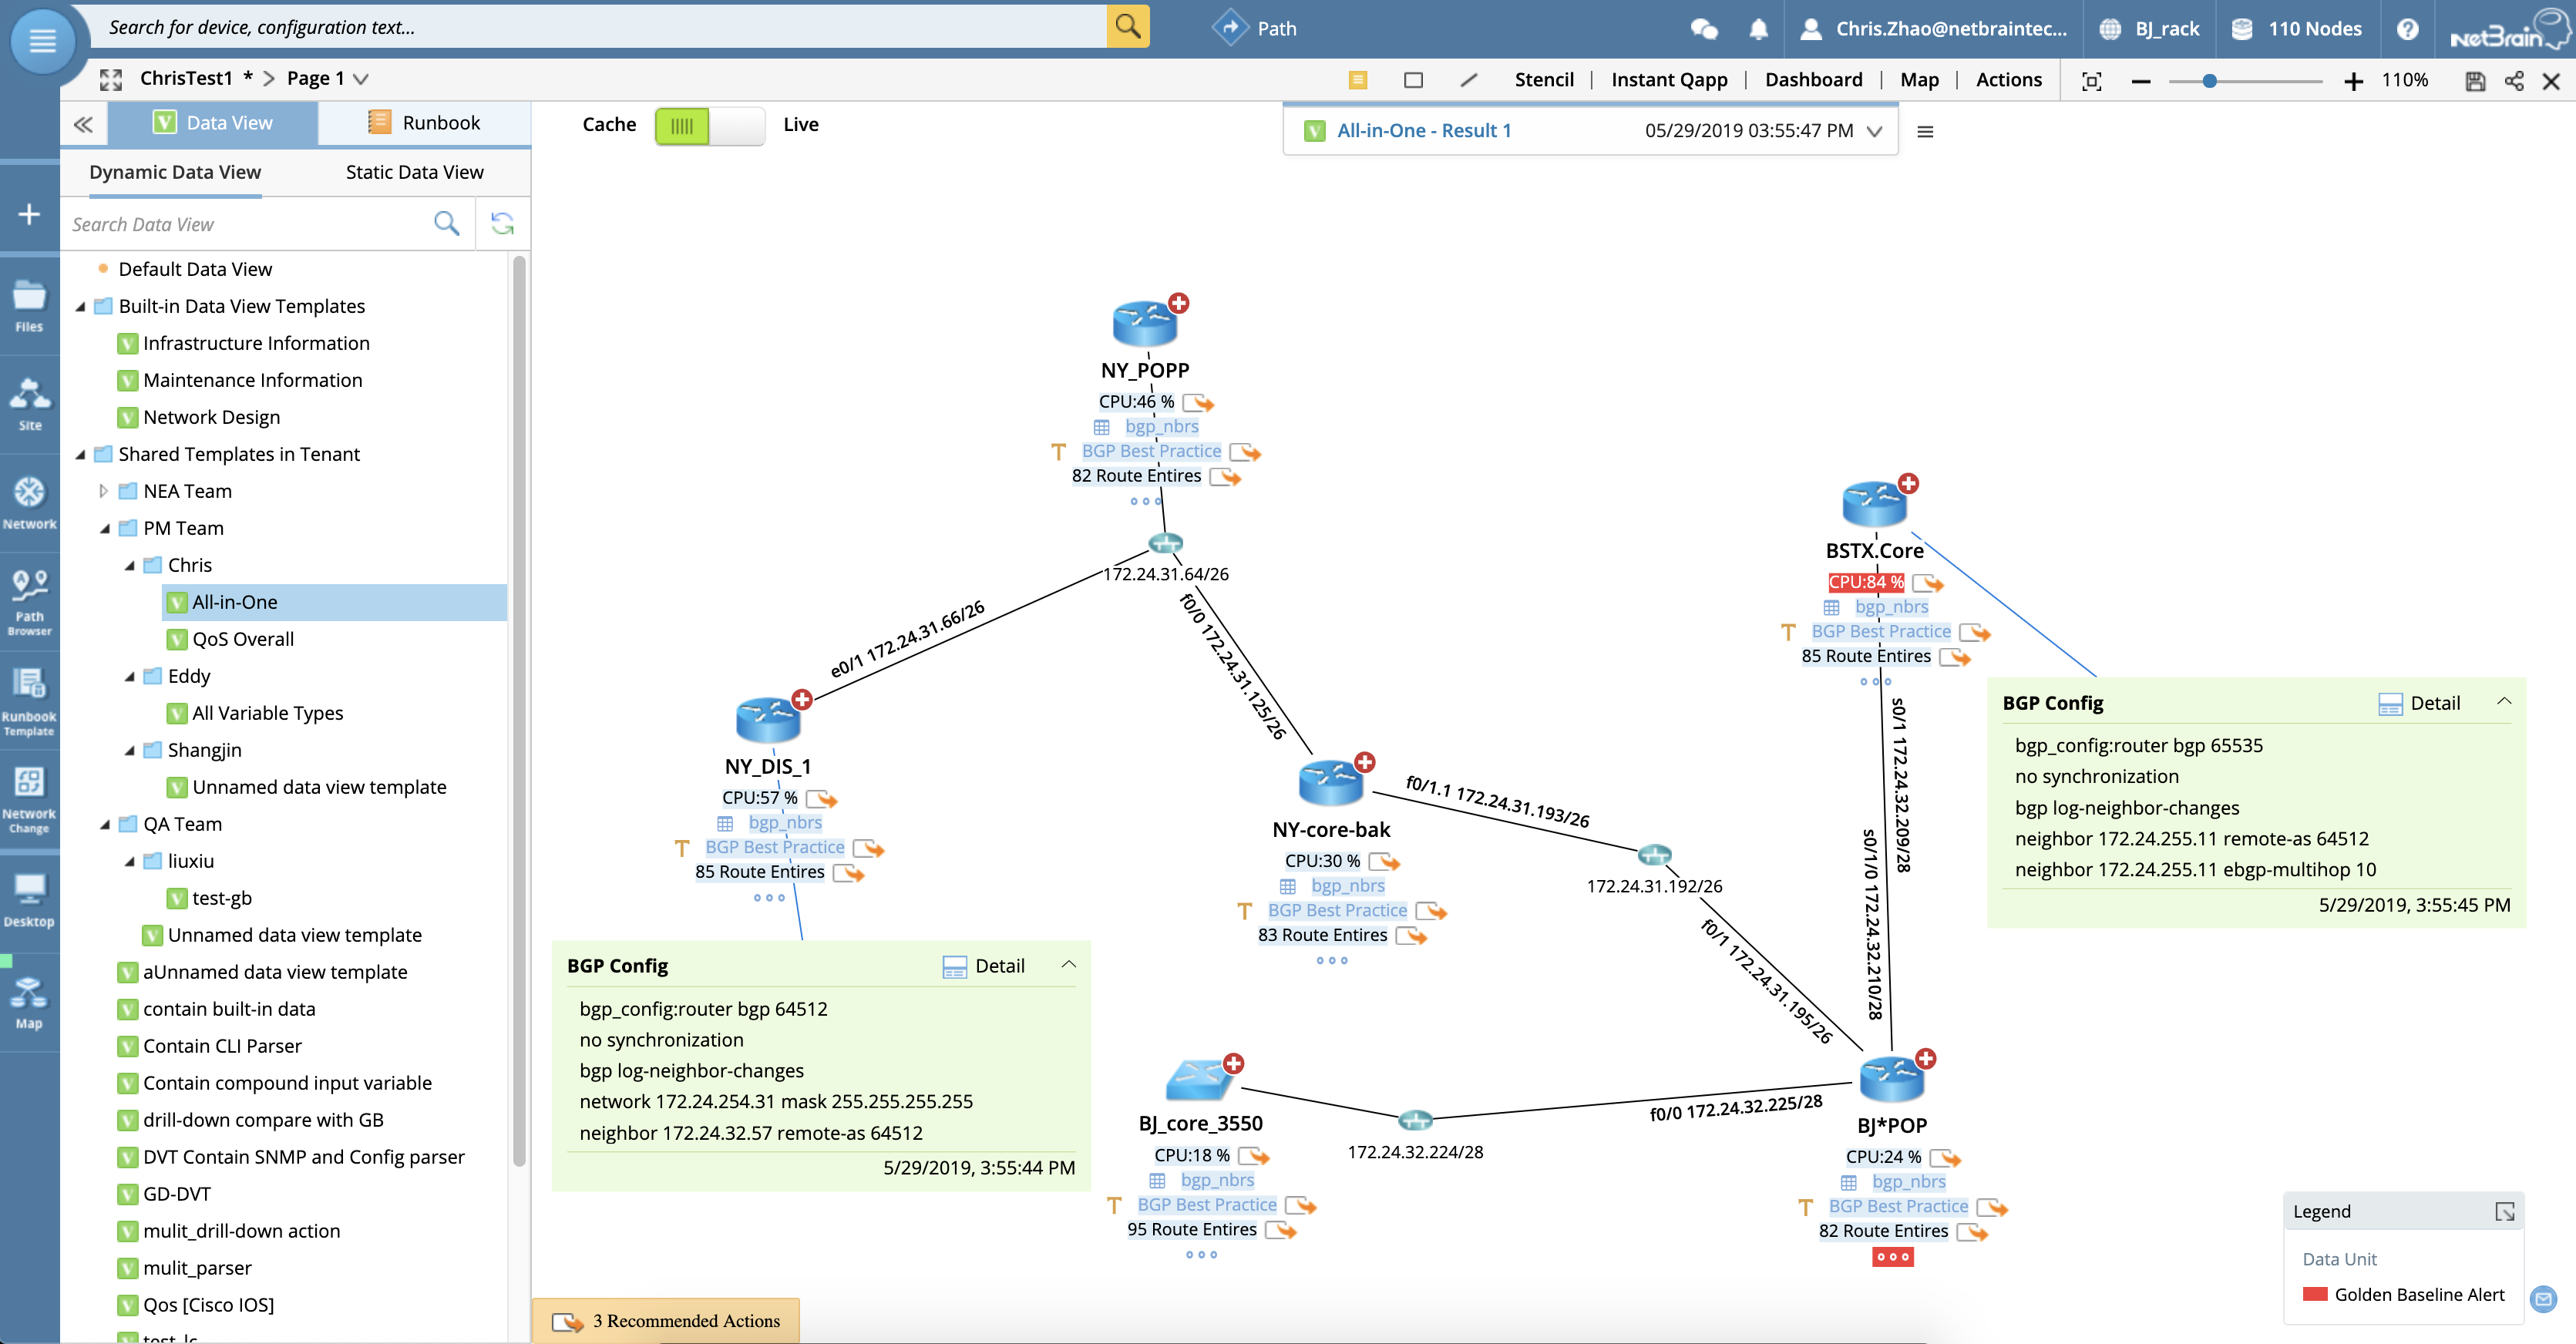
One element that makes NetBrain maps dynamic is the amount of detail present on each device. Each icon on a map is a smart object with potentially thousands of associated attributes. As a user zooms in on the Map, more data will be presented to the user beneath the device and on the links.
If a user hovers over the network element, a configlet will appear with the corresponding section of the device’s configuration file, explaining where the link information comes from.

Besides the built-in default data, users can visualize any network data on a Dynamic Map with Dynamic Data Views (DVT), a customizable data container, which can serve as an engineer’s primary tool for scaling diagnostics across an entire map, network, or Site.
For example, with access to a Data View Template, users could highlight all routing protocols and create alerts wherever BGP is not configured. A user could also overlay QoS policies per device and drill down to each interface to see what traffic is being matched and where. A frequently used built-in DVT is the General Health Monitoring, which shows the performance data of a device such as CPU and memory and the link utilization.
DVT represent codified operational expertise that can be written once and executed anywhere, providing the collaborative framework to ensure that documented operational handoff occurs with any new technology or design implementation.
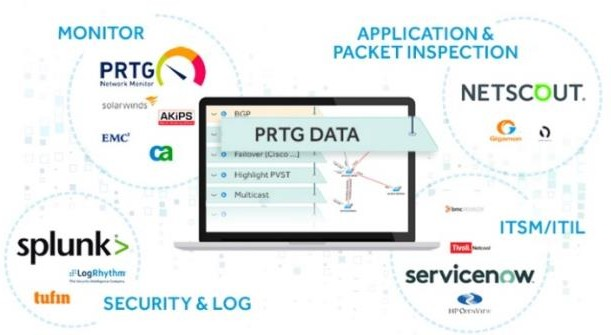
Besides the data from the live network, DVT can be configured to interact with your third-party IT tools via API, which enables you to pull any relevant data onto a Dynamic Map, minimizing the need to log into multiple tools to find the right information. With NetBrain, you can truly map and visualize any data. In this sense, NetBrain turns its Dynamic Map into a Single Pane of Glass (SPOG), acting as the primary user interface for accessing any data from the network or any 3rd party tool.
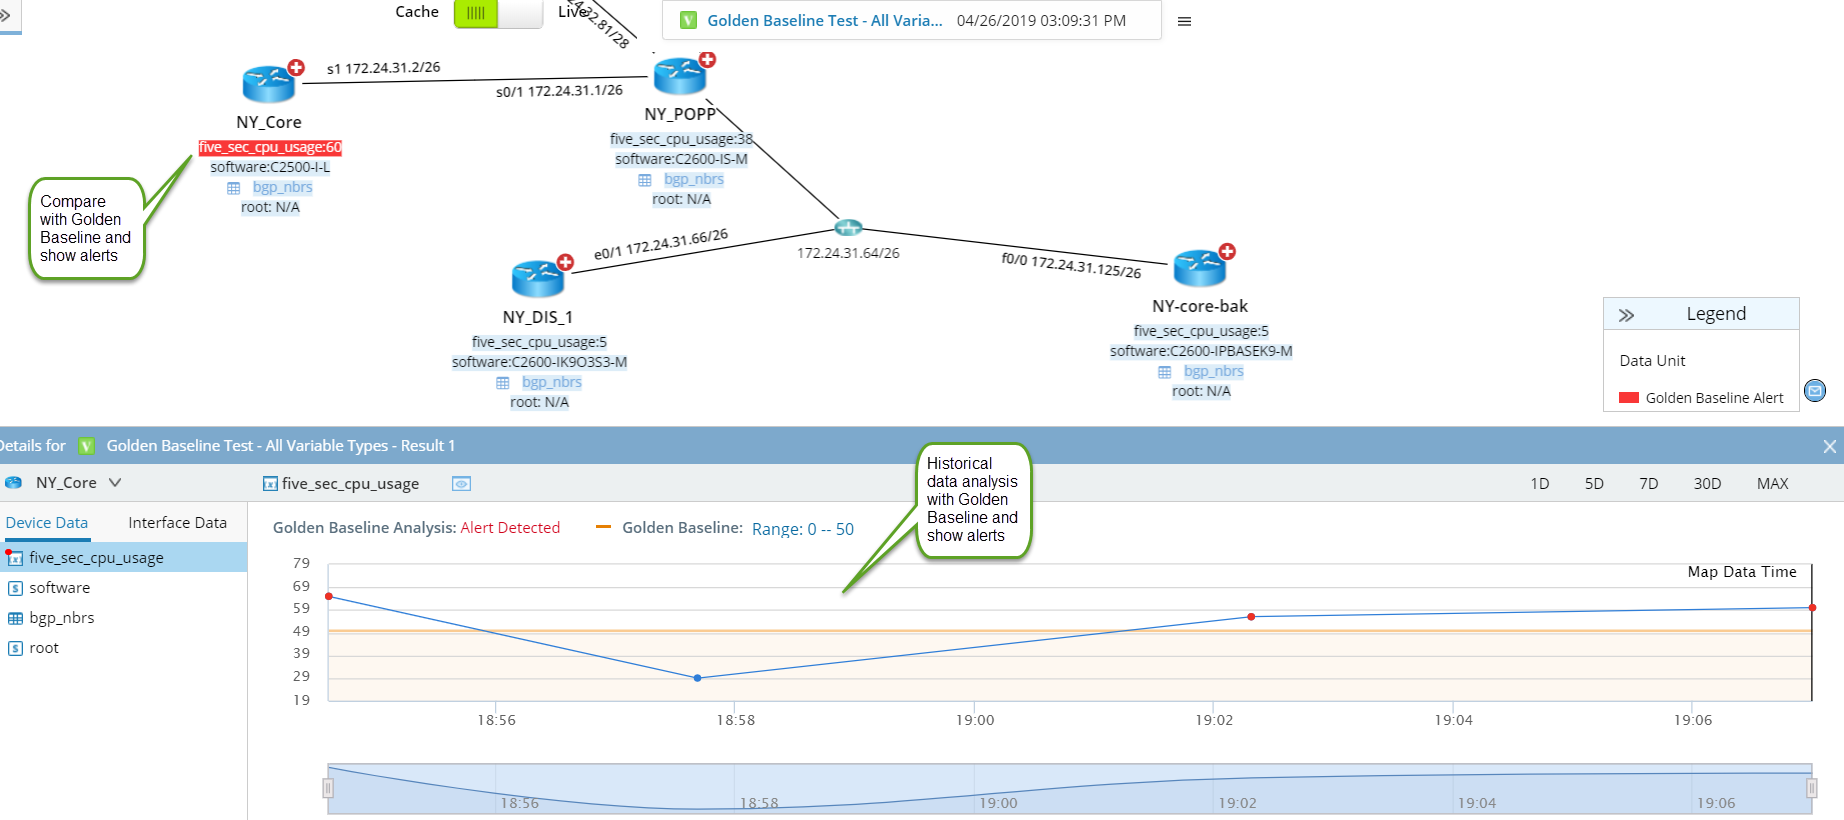
Each DVT can also utilize NetBrain’s Golden Baseline, serving as the reference standard of the health status for various types of data. It can be auto-calculated based on historical statistics or manually defined. DVT can quickly reveal anomalies in network conditions related to the variables within the Data View. When discrepancies are found, users will not only be given the live variable information but also historical data for the variable counter.
Golden Baseline assures that you will always know of any network deviation from healthy or nominal conditions. Over time, it is recommended to add more and more data variables to the golden baseline (e.g., after lessons learned in troubleshooting).