R12.1 Project Publication-2025Dec23
Define Advanced Settings for Triggered Diagnosis
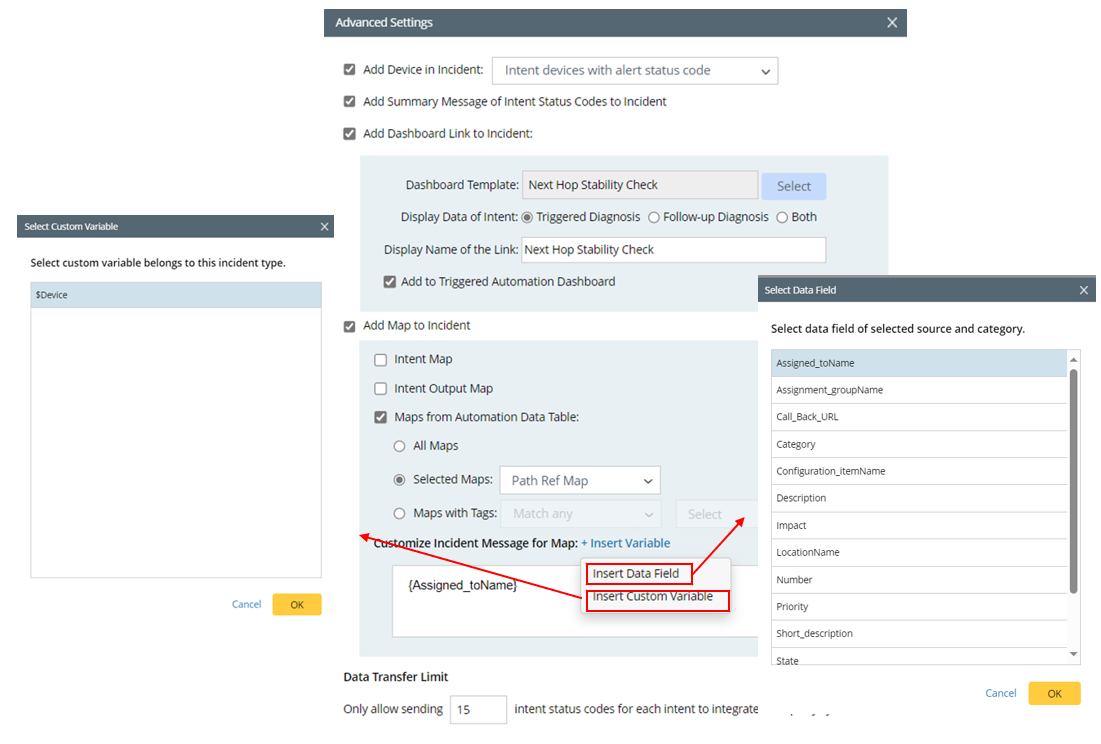
In Advanced Settings window, you can define the information about the triggered diagnosis to be pushed to incident, add dashboard link to incident, and set the number of intent status codes sent to the third-party system. 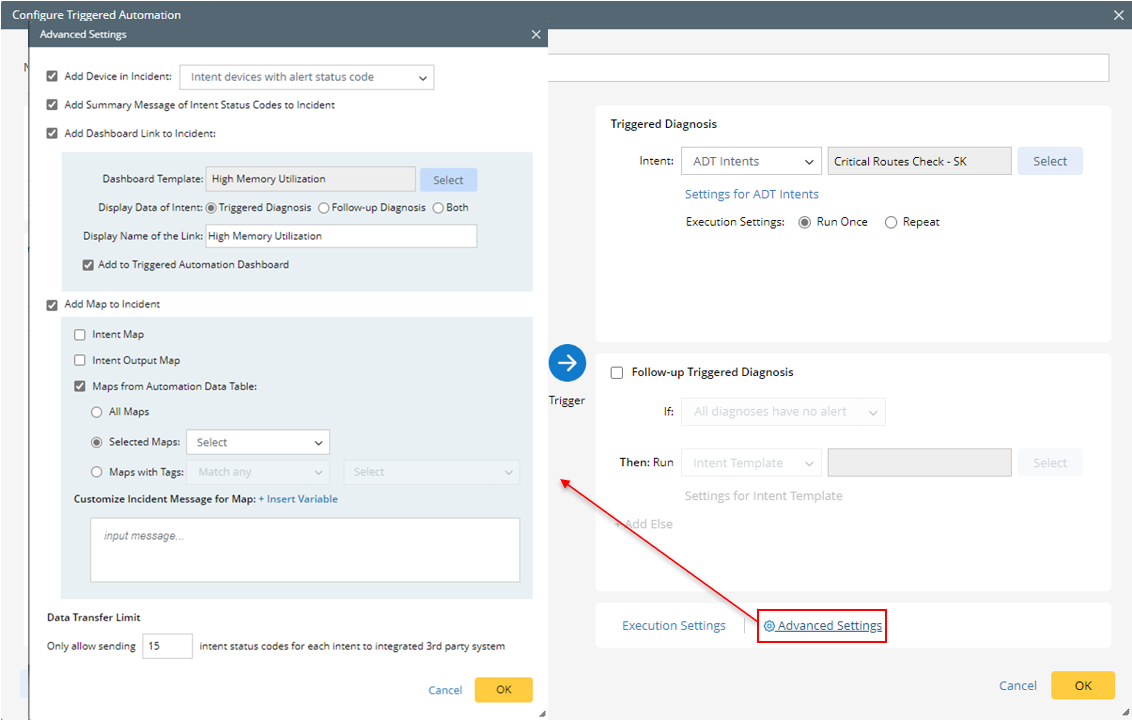
- Click Advanced Settings at the bottom of the Triggered Diagnosis pane.
- Define relevant settings in the Advanced Settings dialog:

- Add Device in Incident: Set the incident device(s) to include all Network Intent devices after Execution.
- All Intent Devices: All devices are added to incident
- Intent Devices with Alert Status Code: Set the incident device(s) to include only the Network Intent Devices with the alert status codes.
- Add Summary Message of Intent Status Codes to Incident: This will create an Incident message with the status code.
- Add Dashboard link to Incident: Dashboard Link can be added to Incident, and users can view the diagnosis results in the Dashboard from incident pane.
- Check the Add Dashboard Link to Incident checkbox to enable this function.
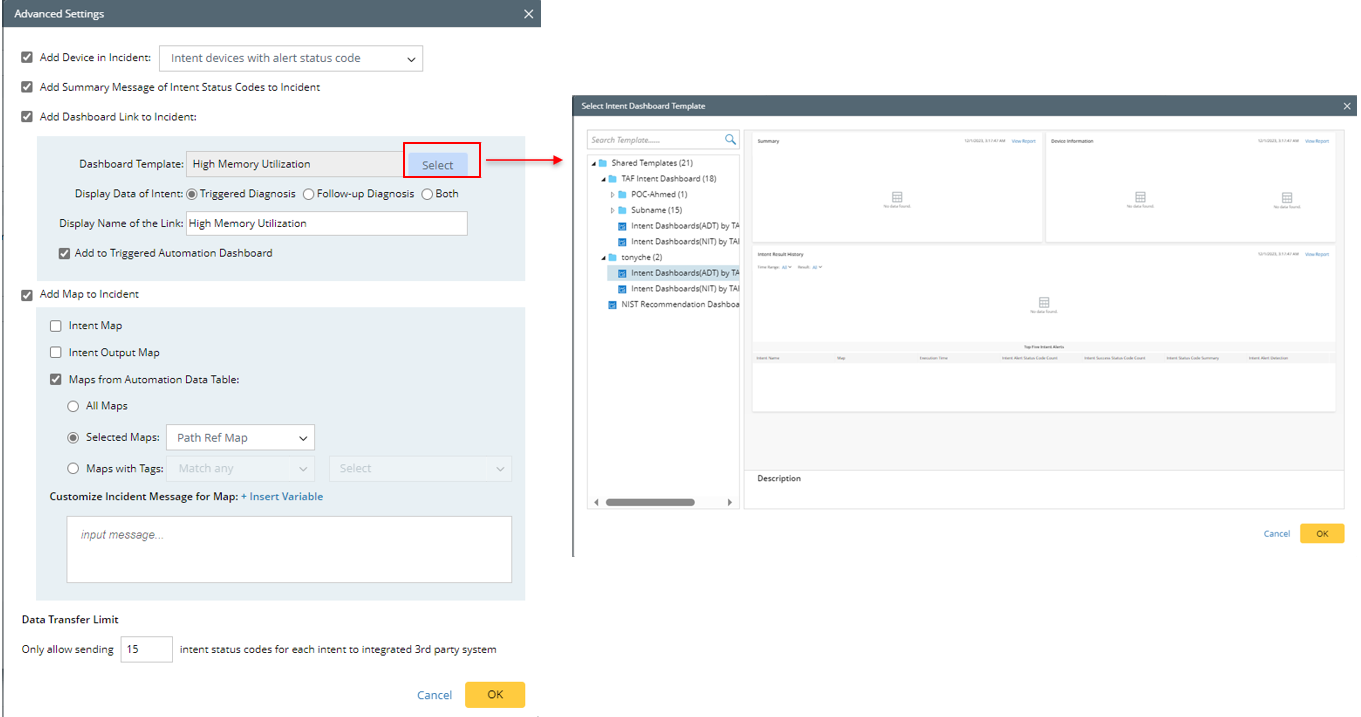
- Click Select to select a dashboard template for creating dashboard.
- Display Data of Intent: Set which intents will be pushed to dashboard. select from the following tree options.
- Triggered Diagnosis (default): Only intents run for triggered diagnosis will be displayed in dashboard.
- Follow-up Diagnosis: Only intents run for follow-up diagnosis will be displayed in dashboard.
- Both: All intents run for triggered diagnosis and follow-up diagnosis will be displayed in dashboard.
- Display ADT Data of Device: Select device variable for filtering ADT intents to be displayed in dashboard. Click
 from this block, then select fields.

Note: Display Data of Intent and Display ADT Data of Device options are not displayed if the selected dashboard template does not support these two parameters. - Display Name of the Link: In this field, enter the dashboard link name to be displayed in Incident. If you do not define the display name, the dashboard template name will be used as the dashboard link name displayed.
Note: The actual dashboard name at the backend is "dashboard template name+execution time”.
Note: Time Range for Displaying Data is also a parameter for creating dashboard. It is set by default and cannot be configured by users. The default time range is the total time scheduled for serval rounds of intent execution plus a buffer time of 1 hour (the start time is the start time of the task).
- Add to Triggered Automation Dashboard: Check the checkbox to enable this function. The intent dashboard will be added to TAF Observability Dashboard. The system will decide which intent dashboard of the diagnosis will be added by matching incident type. For more information, see Add Triggered Intent Dashboard.
- Check the Add Dashboard Link to Incident checkbox to enable this function.
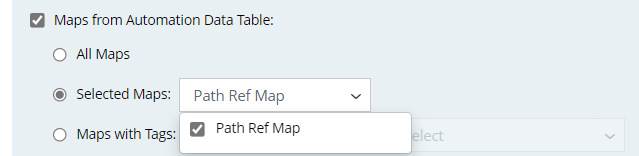
- Add Map to Incident: Three types of maps can be added (intent map, intent output map, maps from automation data table) to the incident pane.You can define the scope of maps from automation data table that will be displayed in Incident. Check the checkbox to select from the following three options.
- Intent Map: Add map associated with the intent to incident
- Intent Output Map: Add the intent output map generated to the incident.
Tip: Intent Output Map is generated during the intent execution, which includes Draw Map logic and intent data view, and intent status codes can be automatically added as part of the intent data view. If there is a follow-up intent, its map output will be automatically output to the output map of the home intent. - Maps from Automation Data Table: If the triggered diagnosis involves ADT intents, you can select maps related to the ADT to incident.
Note: This option is not displayed if ADT intents are not used for triggered diagnosis. - All Maps: All maps related to the ADT will be added to incident.
- Selected Maps: Manually select maps from the pull-down menu to add to incident.
- Map with Tags: Select map tags to match the map to be added to incident by the map tag. There for two ways of matching maps:
Match any: The maps in the map column having any the selected tags are selected.
Match all: The maps in the map column having all the selected tags are selected.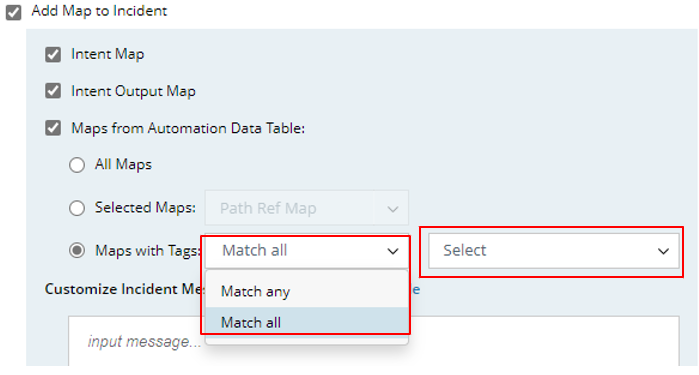
- Customized Incident Message for Map: Set the incident message that will be displayed for the added map. Click “+ Insert Variable” to insert variable in the message. For example, View devices. You can also insert custom variable defined in the incident type.
- Click +Insert Variable.
- Select Insert Data Field> Select the desired data field (for example, "Description")> Click OK.
- Select Insert Custom Variable> Select the desired custom variable> Click OK.
- Click OK.
- Data Transfer Limit: In this field, input the maximum number of status codes for each intent.