R12.1 JA-2025July15
Adding Multiple CLI Commands in a Qapp
You can add multiple CLI commands in a Qapp to parse and analyze network data with different CLI commands. For example, to monitor the general health of a network device, you may want to monitor device-level data such as CPU and memory usage and interface-level data such as input and output errors in the meantime.
In this section, modify the Monitor CPU Usage Qapp created in the previous section and add a command to it to monitor interface-level data of network devices.
- Edit the Monitor CPU Usage Qapp. In the Qapp Center, click the folder where the Qapp was saved, point to the Qapp and click the
 icon to select Open.
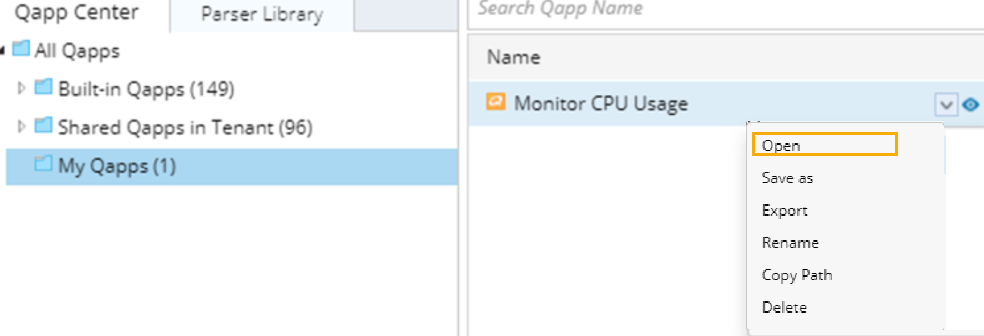
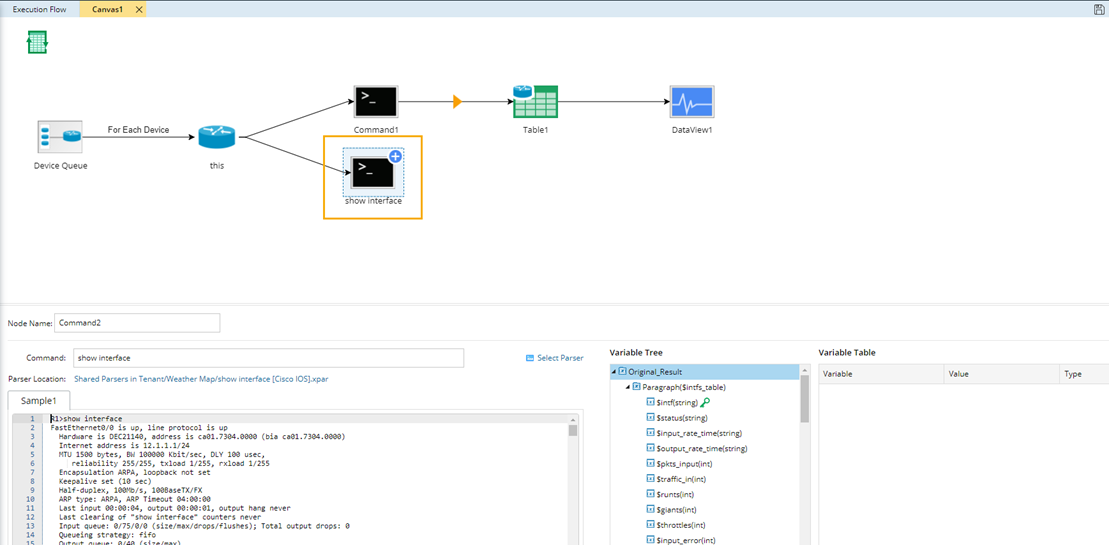
- Double-click the Canvas node to enter the Canvas Editor. Point to this node, click the
 icon, select CLI and click Extend to add a CLI command node.
 - Enter show interface in the Command field and select show interface (Cisco IOS Switch, Cisco Router) from the drop-down list. The related command, parser, and variables will be auto-loaded.

Tip: The content in brackets refers to the device types that the parser applies to. - Click the icon on the CLI command node, select Device Data Table and click Extend. A Table node is added and it is used to store the parsed data passed from the CLI Command node. For a Device Data Table, it only contains data for one device in the current loop and can only be referenced in the current canvas.
- Click the
 icon to export the variables defined in the CLI node to the Table node.
All the variables defined in the parser are listed in the left pane. For example, hold the CTRL key and click the intf, input_error, crc, status and output_error to choose them, and then click Attribute >> to add them.
Note: When adding interface-level variables, you also need to add the key variable ($intf). This key variable will be used as the key to match an interface- level variable with the interface that the variable belongs to at Qapp execution.
Tip: NetworkBrain parsers show the parsed data in two forms: Single Value and Table. For variables in the Single Value form, you can export them to a Table node as row data by clicking Table>> or as table attributes by clicking Attribute>>. However, for variables (mostly interface-level variables) in the Table form, you can only add them to a Table node as row data by clicking Table>>.
- Point to the Table2 node, click the icon to select Data View and click Extend. The variables defined in the DataView1 node are automatically loaded in the DataView2 node.
- At the Data View node, click Select Data Unit.
- In the Select Data Unit dialog, select Canvas1. Table2, select intf from the Interface list, select crc and collisions and then click OK.
- Customize the display positions for these variables on a map.
A variable can be displayed as either a device item or the interface item. In this sample, crc and collisions are interface-level variables, and you can select positions along the link. - Define alerts for interface-level variables. Click the
 icon of the variable input_error to add an alert and define the alert condition for this variable: select Basic to define the threshold condition, select operator >= and enter a default value to compare the current value [now] against the default threshold. Here we just create an alert message “Input errors!” when the current value [now] >= 1. In a similar way the alerts can be defined for the integer variables crc and output_error. The variable status is string variable, you can also define an alert for it. Click the icon, keep the default alert type Basic. The operators vary on variable type. Here select the operator Contains, enter down in the default value field and create an alert message ‘interface down’ in the Then field.
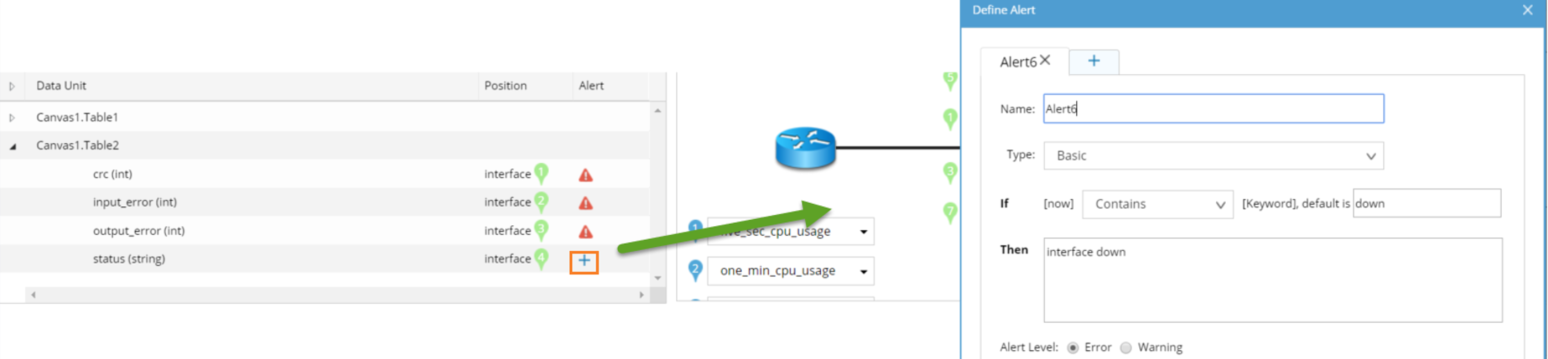
- Define the color scheme for interface-level variables so that the visual alert can be caught along the interface in the map. Click Define Visual Alert at the DataView2 node. Three are three colors for interface-level variables based on the alert level. Select the variables that you want to apply the scheme and click OK.
- Save the Qapp and rename it Monitor CPU and Interface Error.
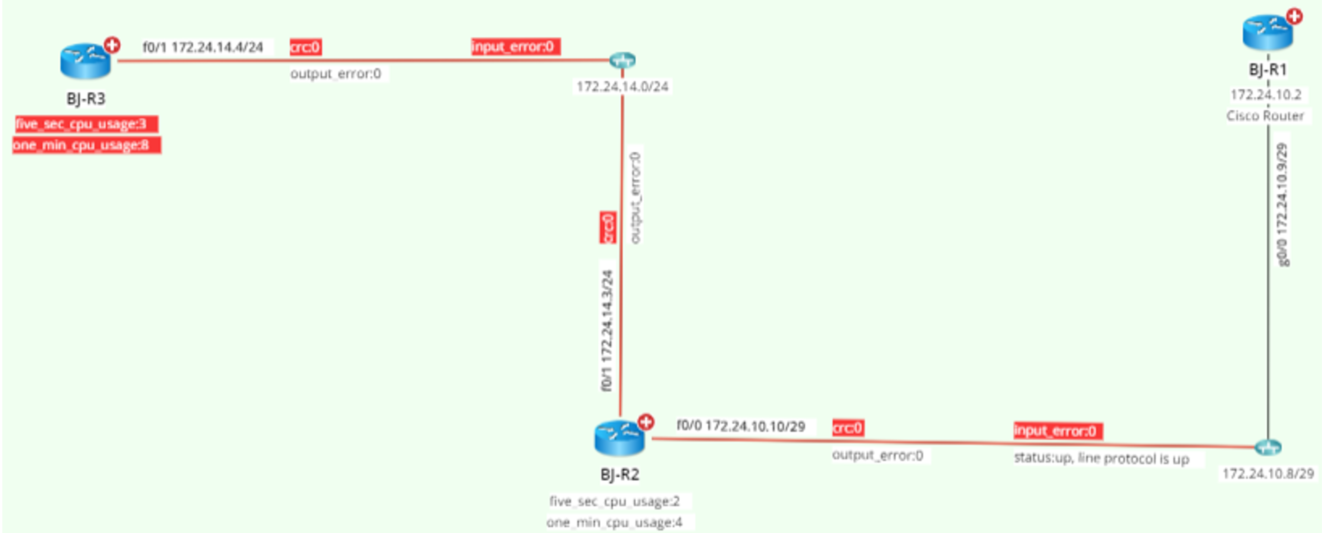
- Run the Qapp. Select Pull live data regularly as the data source, set frequency as every 1 minute, modify the threshold of CPU usage to 5 and input_error >= 0 for demo purpose and click Run. The following is a sample result. The input_error variable turns red if $intput_err >= 0.