10.1.15.12-06212024
Summary Dashboard
Summary Dashboard offers a comprehensive overview of the automation results for the entire network.
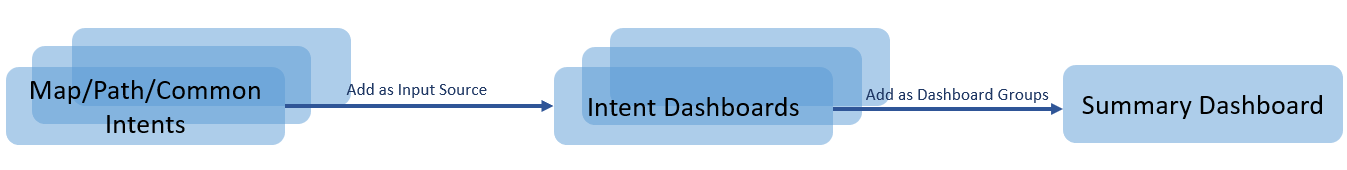
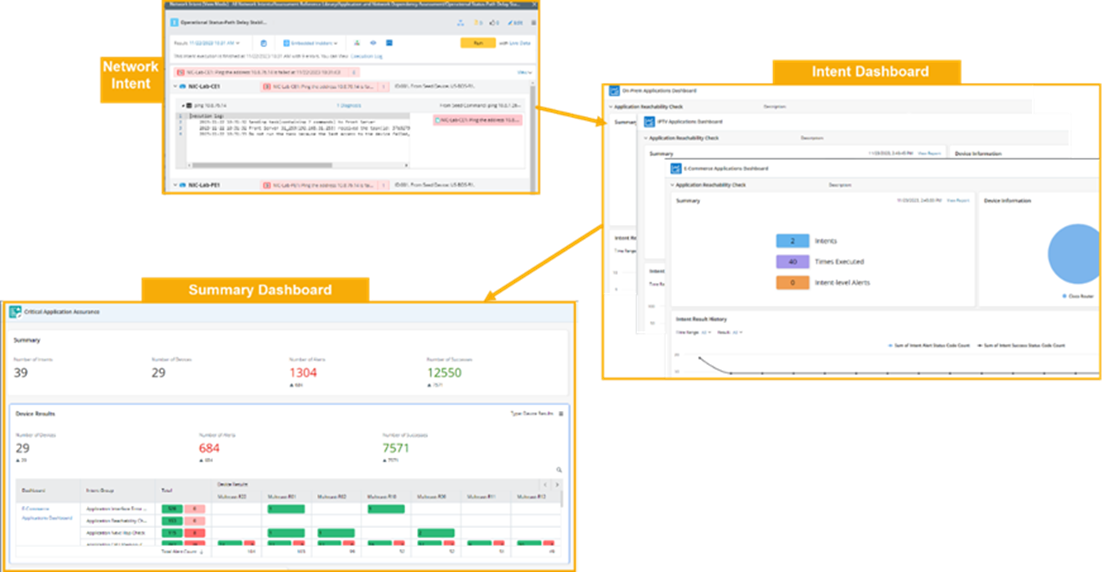
While the Intent Dashboard observes specific network issues with details, the summary dashboard provides an overall view by displaying intent results from multiple Intent dashboard. With Summary Dashboard, you can group Intent Dashboards into widgets based on diagnosis purposes, and display intent results by device, site or device groups. You can use the summary dashboard to monitor critical information across thousands of devices and discover the root cause for issues in one view.
There are two major workflows supported by the summary dashboard:
-
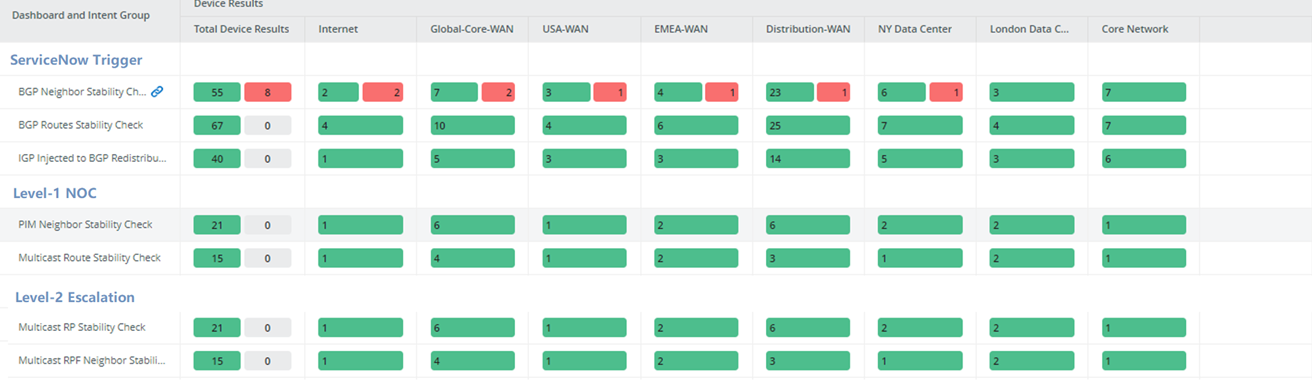
Collaborative Troubleshooting: Build a summary dashboard to help collaborate with other engineers on network troubleshooting. In this case, each row inside the summary dashboard represents a diagnosis activity, and each column represents a device or a network, specifying where the issue happened. The red color indicates issues are happening.
-
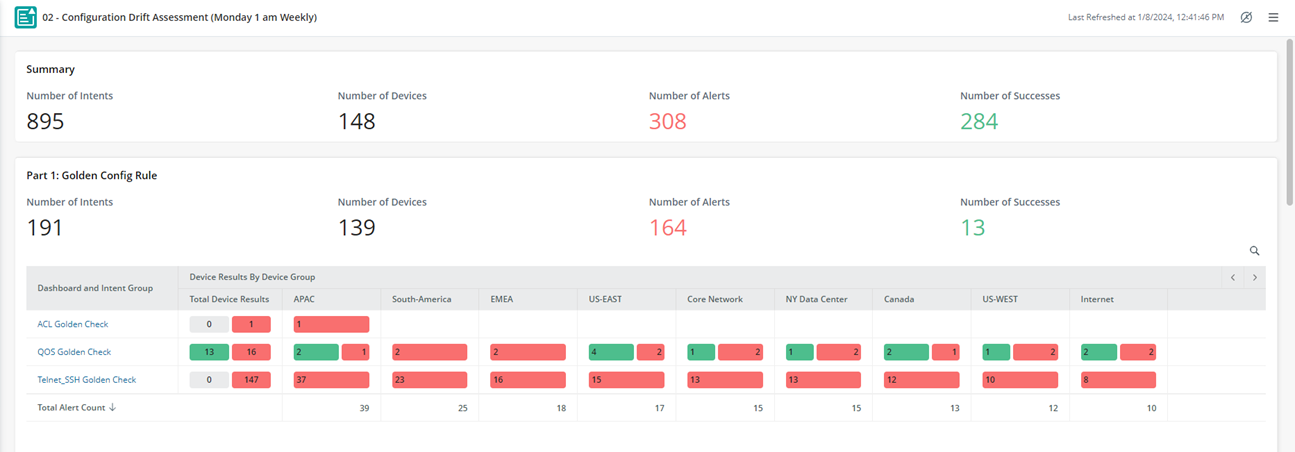
Continuous Assessment: Build a summary dashboard to display the result from scheduled network assessment and catch the issues before active impact. In this case, each row inside the summary dashboard represents an assessment point, and each column represents a device or a network, specifying where the issue happened. The red color indicates there are problems found.