 by Mark Harris Jan 3, 2022
One of the most commonly used tools in network troubleshooting is arguably the traceroute (and its little brother ping). As helpful as this tool is, there are a few critical challenges of using traceroute to handle today’s much more complex problems. Remember, that traceroute was created in the late 1980s when networks were far simpler; everything was physical, point-to-point was all the rage, there were fewer protocols to deal with and switches were commonly referred to as bridges, with LAN-to-WAN routers traversing from one building to the next building. (Remember this was half a dozen years before the Internet even existed)! And who remembers ‘Leased T1 Lines’? The good ol’ days so to speak.

So how do antique tools such as this hold up in today’s world of software-defined and virtualized everything? Surely there must be a more modern way to help troubleshoot today’s networks? Yes, there is so keep reading…
To get started, let’s understand a little more about what a traceroute command is.
What is a Traceroute Command?
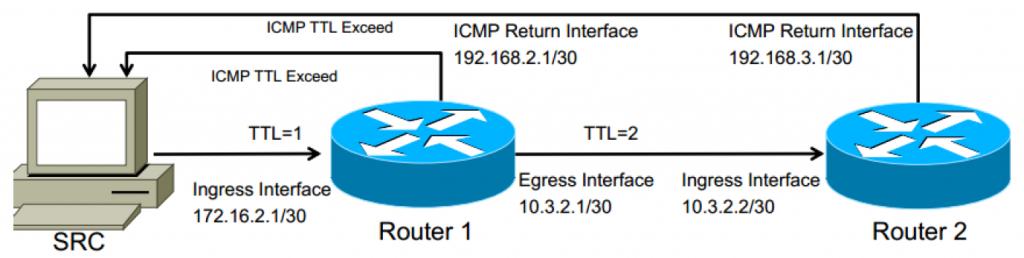
The source (SRC) machine will typically send 3 probe packets toward the destination IP address, starting with Time to Live (TTL) set to 1. The probe packet type is mistakenly thought to always be ICMP when in reality, it depends on the device originating the traceroute. Windows operating systems will often use ICMP, while Unix and Routing devices will more commonly use UDP messages to ephemeral ports (ports greater than 1024 which are not well-known services like DNS, SMTP, WEB, etc…)
As the probe packet is received at each layer 3 device, the TTL is decremented. When TTL reaches 0, the receiving device will send an ICMP message “TTL Expired” from the interface that received that packet. This is how traceroute knows each hop along the way.
In the picture below, 172.16.2.1 and 10.3.2.2 would be the addresses returned in the traceroute results.
Challenges with Traceroute commands for today’s networks:
#1: Asymmetric paths cannot be seen easily. Only A-to-B is reported by default. B-to-A requires another traceroute from the other end to complete the path.
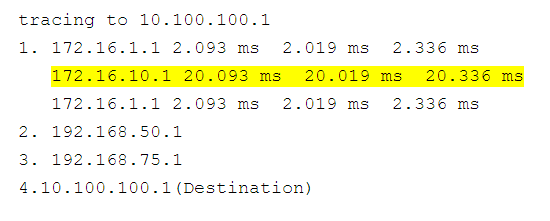
Asymmetric routing is commonplace in networks today. There are many equal-cost multi-path (ECMP), and even unequal-cost multi-path routing protocols in play, and depending on the hashing algorithm, traffic will likely take a different path in each direction. These different paths are very difficult to detect with a single traceroute command execution, and therefore very difficult to detect exactly where the delay result is coming from being impacted.
As you can see above, the delay value jumps up at this particular hop, but the question is “Where is this delay?” Is it on the forward path, or on the return path?
#2: Interfaces are not known, only the device IP node. There is no additional detail.
If we look at the traceroute above again, the only information provided is a hostname/IP and a delayed result. If a user were to investigate hop 6, they would need to telnet/ssh to the router and determine which interface this IP address was attached to (show IP route 129.259.2.41 was my favorite way to determine this, but you could show IP interface and pipe the output to a parser… show IP interface brief | in 129.150.2.41). Secondly, to determine the egress (outgoing) interface, a second look-up would need to be completed to determine this information (show IP route 192.41.37.40 for example)
#3: Traceroute relies on ICMP messaging which may report a longer delay than is actually perceived by traffic since they are processed on the “slow path” of a device vs. the “fast path” that is used to forward data passing through the router.
Slow-path is most easily summarized as when the router needs to process the contents of the packet. Virtually any packet that is destined for a device is handled this way. Newer routers have internal mechanisms to prioritize which packets they process (routing protocol updates before ICMP messages), but this only increases the issue here. As we’ve discussed earlier, most systems will use a UDP message, however the act of generating the ICMP TTL expired message is a lower priority and then the return path will be an ICMP message, so the delay metrics provided in the results are difficult to accept as real problems.
TIP: When you see a traceroute that jumps at a particular step in the result and all following results are low, this is an indication that the “slow” router is delayed in processing. If the path jumps and then each following step along the path is incremented, this typically means some form of queuing due to congestion.
#4: Traceroute output is the static text that cannot be acted upon easily.
Alright, so now we know the path toward a specific destination, but what if I want to dive deeper into one or more hops along that path? Telnet/SSH console session will require the user to log into these devices. Only the interface IP address is provided in the traceroute response. This can pose a challenge in many networks, since, from a security policy perspective, users must telnet/ssh to the management IP address. Telnet could be blocked on the specific interfaces being reported in the traceroute, which requires some form of manual lookup to determine the management interface of a device with that interface address. Without DNS resolution, this may be almost impossible. When there is an outage, every second can be counted against you.
#5: Equal-cost paths are not represented (only the actual path traversed is reported).
As mentioned earlier, equal or unequal cost multi-path routes are commonplace in most networks today. Traceroute will only report on the specific path that was part of the inquiry probe messages. Since the most common traceroute implementations send 3 probe packets with different UDP destination ports, it is possible that in an ECMP environment, each hop will have up to 3 different IP addresses reported. Keeping track of which response is part of which path can become cumbersome.
#6: Traceroute is Layer-3 (it does not report on Layer 2 hops)
As we now understand, traceroute works on decrementing the TTL value in an IP packet and generating TTL expired ICMP messages. TTL is only decremented on layer 3 devices, so there is no built-in visibility, or the ability to easily determine the layer-2 path taken from the result. In Enterprise and Data Center environments, there is almost always some form of layer-2 access switch used for aggregating end stations. In some designs, there is also a layer-2 distribution layer before reaching a core router that actually performs the first layer 3 routing function which can report back to a traceroute request. If packet loss is presented in the traceroute output, it could be due to improper hashing of a layer 2 port channel or Link Aggregation Group (LAG), spanning tree issue, duplex configuration on a switch, or another issue that can only be discovered by inspecting the layer 2 elements along the path. Finding this information would require:
- Determining the MAC address of the source device on the layer 2 segment, (checking the ARP table on the router or on the source device,
- Checking documentation to determine which switches are in use
- Logging into each possible path and checking MAC tables for the specific MAC address,
- Running commands to check performance and configuration
- Determining the trunks leading away from the active device
- Logging into the next layer2 device and repeating the process until reaching the first router.
This process can be very time-consuming especially if CDP/LLDP is not enabled in the network or documentation is outdated.
#7: Traceroute is missing historical information
The results you see with a traceroute are the current state. There is no way to determine what the path was when traffic was successful (yesterday for example). Consider the traceroute below, it would be good to understand what hop 4 was before things changed to help isolate the possible issue.
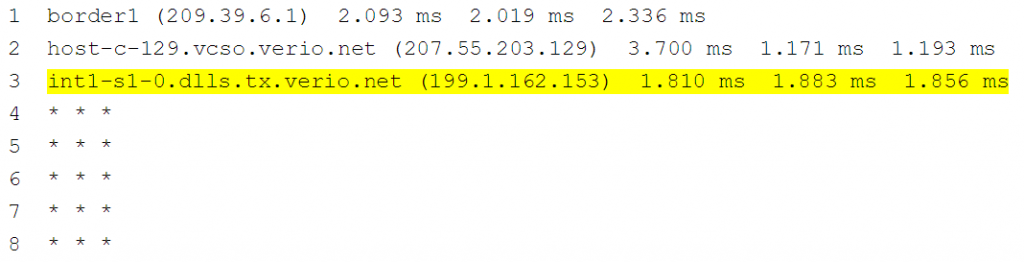
NOTE: It has been our experience that based on the output of the above traceroute command, engineers will assume that hop 3 is the problem. This is often not the case. The first check a user should perform is to log into the device at hop 3 and check if the device has a routing entry to the destination. If so, often, the problem device is the next-hop in the routing entry. To be thorough, checking the egress interface towards the routing next-hop is useful to verify interface level performance and ACL configuration.
#8: Traceroute has a cryptic error messaging system.
When I run into a traceroute command issue, every now and then I get a character in the output that surprises me. The table below is from Cisco’s Implementation of traceroute. While they may seem straightforward enough, understanding exactly what is happening almost always requires additional follow-up digging.
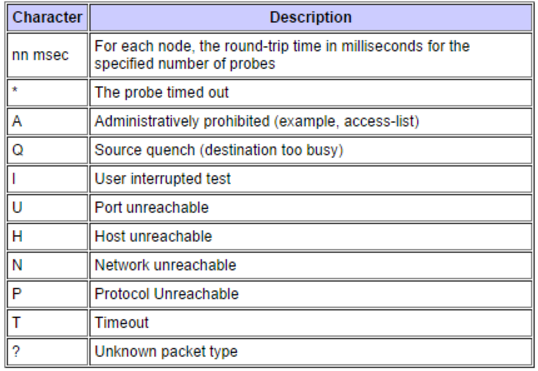
Say, for example, I receive the letter A in the traceroute response, I can understand that there is probably an access-list blocking the traceroute, but which access-list is it? To determine this, I’ll need to log into the router, determine which interface the packet entered, verify the configuration, and investigate the access list when I find it. This can be a lengthy process, and since we are always concerned about the time when it comes to troubleshooting issues, it would be great to have a better way to gain access to this information.
NOTE: In our experience, these error messages are only ever provided based on the ingress interface. Once a packet is received ok and then forwarded to the next hop along the path if there is an ACL on the egress port, you simply get a * * * for the next hop which means additional steps to ensure that the egress interface is known, and any ACLs validated on that port as well.
What’s the Modern Solution?
NetBrain includes a wealth of automation and visualization features required to maintain modern networks. It understands software-defined, virtualized, and even the cloud. It continuously communicates with every device on the end-to-end network and builds a real-time digital twin of the network. This digital twin is an exact replica of the details of every device. It includes the ability to visualize real-time networks and includes a modern replacement for traceroute, referred to as the A/B Path Calculator. This addresses all these challenges by helping engineers dynamically map a network path between any two points in the network and provide extreme detail of that path. This function supports mapping through modern technologies (e.g. SDN, SD-WAN, firewalls, load balancing), underlays, and overlays, all while considering advanced protocols (routing, access lists, PBR, VRF, NAT, etc.). And once deployed, the same structure that can be visualized in real-time now creates the perfect platform for no-code automation of every task, big and small!
Three Real-World Examples of the A/B Path Calculator
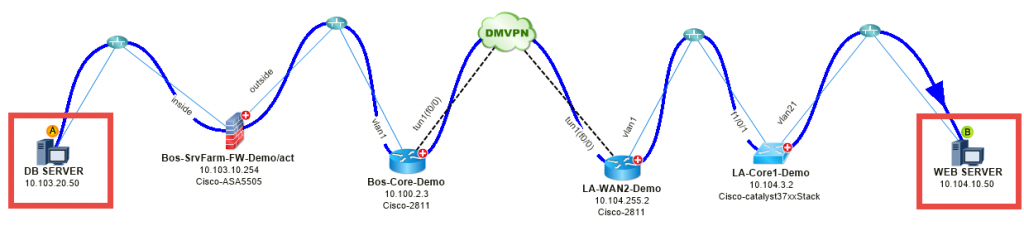
#1: Map a slow application – A web application is slow between Boston and Los Angeles.
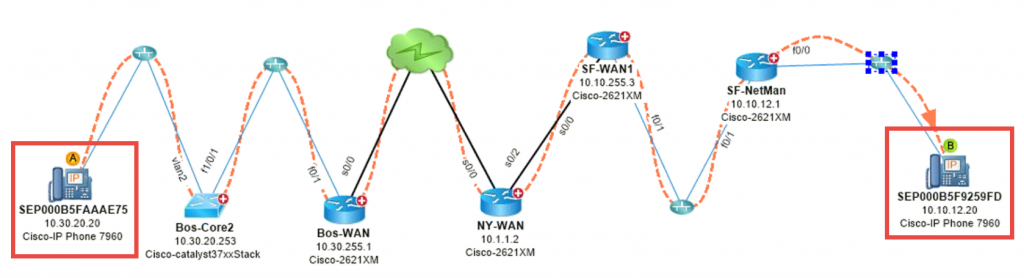
#2: Map VoIP Traffic Flow – Voice traffic is jittery between Boston and San Fran.
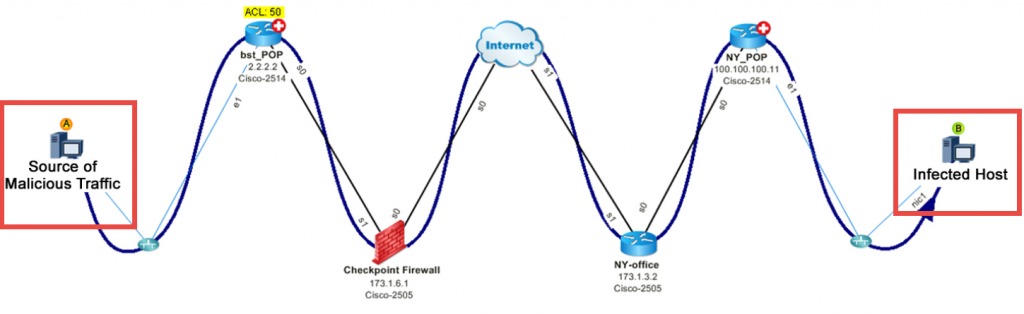
#3: Map DDoS Attack – A malicious host is injecting DoS traffic on the network. Where’s the traffic coming from, and what’s the impact? By leveraging NetFlow to identify the top talker, you can map the path.
Service-Delivery Assurance
NetBrain’s Application Assurance (AAM) maps all your application hybrid-cloud network paths in a single view, continuously validates end-to-end path performance against healthy path baselines, and proactively alerts the right teams so they can act on problems before they disrupt your business. It provides your teams the ability to quickly troubleshoot and diagnose application performance at the traffic-flow level.
It’s possible to now prevent application performance degradation with NetBrain’s no-code Intent-based automation.
NetBrain AAM protects the user experience by:
- Automatically mapping all possible application paths and their devices
- Defining behaviors for all application paths
- Baselining live application paths against “golden” paths on maps
- Visualizing the performance and history of every application path in a single dashboard
- Alerting you to potential problems as soon as application path performance degrades