by Matthew Speidel Nov 22, 2017
An Executable Runbook is a programmable set of procedures, which can be used by anyone to automatically collect and analyze specific network data. Like traditional playbooks, Executable Runbooks provide a way for tribal leaders to document their knowledge and share it across the team. What makes Executable Runbooks different is that the entire procedure can be executed leveraging automation. For all their power, runbooks are incredibly easy to build and use. Just follow a simple formula:
Build it. Run it. Share it.
Part 1: How to Build a Runbook
Step 1: Define Your Workflow
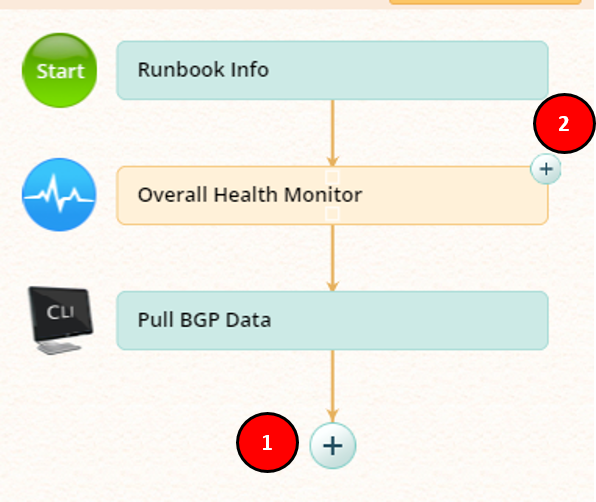
At its core, a runbook is simply a series of steps, called “nodes.” When you define the workflow of a runbook you’re basically creating a flowchart, just like you would for any conventional procedure. The process is very simple.
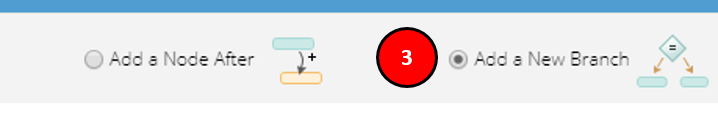
To add a new step to the procedure, just click the plus sign sticking off the bottom of the chain (1). Alternatively, you can add a branch to the procedure – just click the plus sign on the step you want it to branch from (2) then specify a Add a New Branch (3).
Step 2: Program Your Automation
Remember, each step in an Executable Runbook is powered by automation. To customize the automation, simply specify what you want the user to do at each step of the process. There are several types of steps available to you:
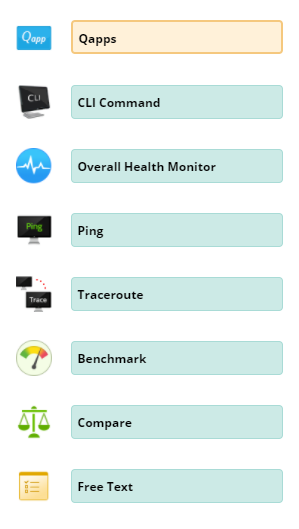
- Qapp™ – Qapps are customizable programs that leverage automation to pull data from network devices and analyzes it to help engineers draw meaningful insights. In a runbook, you can specify one or more Qapps for the user to run. About 150 Qapps come with NetBrain out of the box, and you have two easy ways to build your own: (a) Use Instant Qapp™ to drag-and-drop any data point(s) to the map, then save it as a Qapp or (2) create more complex Qapps with NetBrain’s Visual Programming Environment – no scripts required! View our Qapp exchange.
- CLI Command – This node will bulk-pull a set of specified CLI show commands from all devices the user is analyzing.
- Overall Health Monitor – Run the #1 most popular built-in Qapp, which monitors the top 5 causes of network slowness. Always a good first step when troubleshooting!
- Ping / Traceroute – These classic tools of the networking trade are built right into the NetBrain platform.
- Benchmark – Quickly pull a set of basic data, like config files, route tables, et cetera. You can throw CLI commands into the set too.
- Compare – Perform a delta analysis on data sets from different points in time. Since over 50% of unplanned outages are caused by config changes, this is extremely useful for troubleshooting.
- Free Text – A node without a specific action. Use this when the specified task must be done outside of NetBrain, such as physically checking cables.
Step 3: Transfer Your Knowledge
Runbooks are a great way to document and share knowledge and best practices within your organization. Every node you create has a “Description” field, where you can put information for the runbook users’ benefit. This gives you the ability to tell the users not just what data to collect, but why they’re collecting it, what to look for, and what to do if they find X, Y, or Z.
The difference between a good runbook and a great runbook is simply taking the time to write good descriptions.
Part 2: How to Execute a Runbook
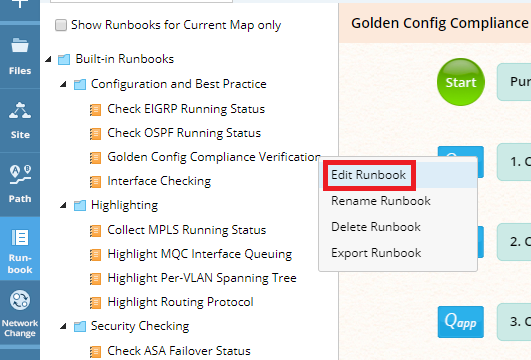
Step 1: Select Your Runbook
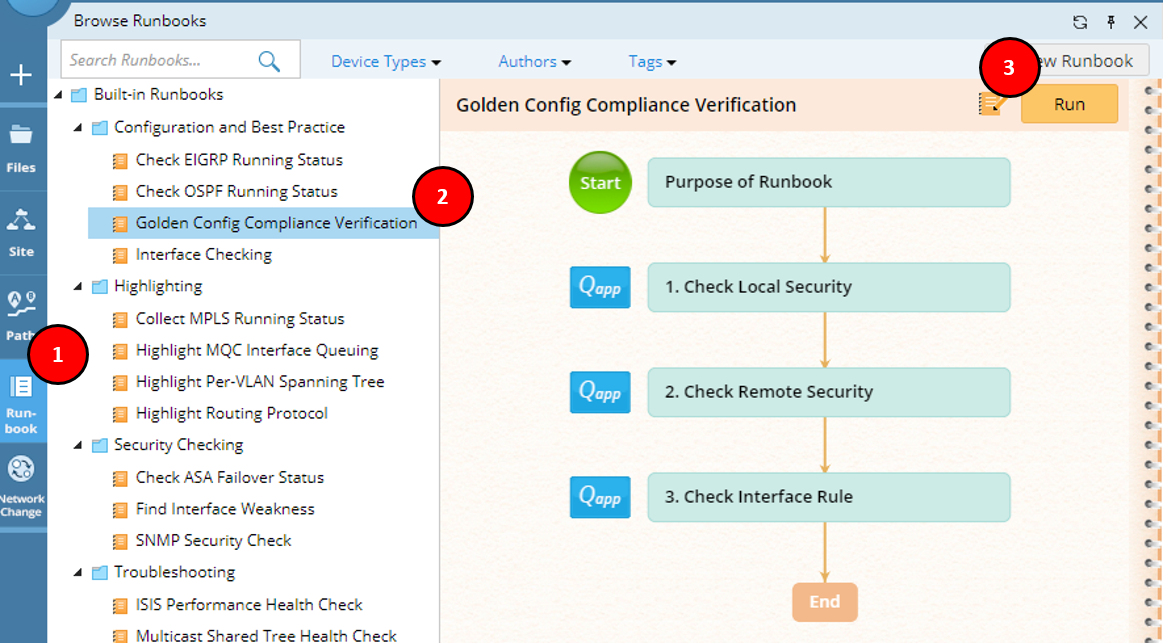
To use a runbook simply click the “Runbook” button on the Taskbar (1), select the runbook you want to run from the list (2), and clicking “Run” (3) to launch it.
Step 2: Execute the Runbook’s Steps
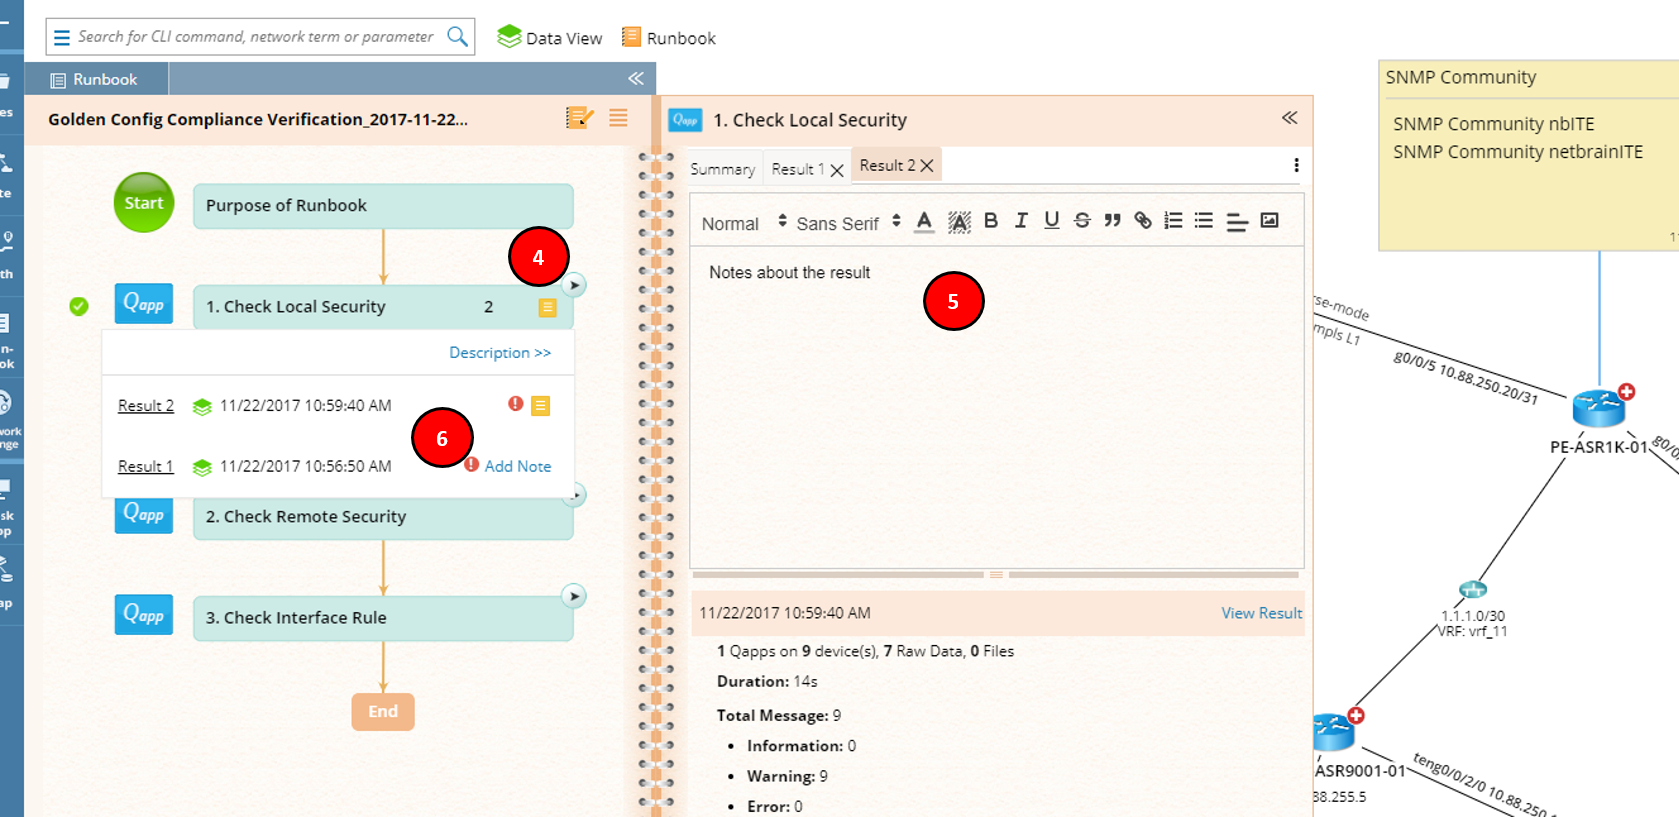
Executing each step is as simple as clicking its “play” button (4). The resulting data from the analysis is stored within the runbook. You can type any notes you have alongside each step (5). Data from different results are stored separately so any problems highlighted are instantly accessible (6).
Runbooks automate time-consuming data collection and analysis, so you can simply review the data to draw your conclusions.
Step 3: Set Up API-Triggered Automation
Thanks to NetBrain’s RESTful API integration, other IT management platforms can trigger the execution of entire runbooks automatically! You can easily set it up such that when your performance monitor sounds an alert, when your IDS detects an intrusion, or when a user submits a trouble ticket, the respective systems will automatically trigger NetBrain to map and analyze the indicated network area. This dramatically reduces your MTTR, even beyond the reduction you get with normal use of NetBrain. It also ensures that the data you need is pulled while the problem is happening, not ex post facto.
The problem area can be mapped and critical data gathered before an engineer even opens the ticket.
Part 3: How to Enhance and Share Runbooks
When a networking team’s top engineers start distilling their knowledge and experience into Executable Runbooks, it has an immensely positive impact on the entire team’s confidence and performance.
Step 1: Save Runbooks to the Shared Repository
Every NetBrain domain has a “Shared Runbooks” category in its Runbook Center. You can simply save your runbooks here to make them instantly accessible to all authorized users. This is a merciful upgrade from the old-school methods of fiddling with PDFs in server shares, or handing out physical binders full of procedures. Now you can be sure that everyone on the team is working from the exact same set of procedures.
Step 2: Review Runbook Results for Painless Postmortems
With everyone involved in a given incident working on a given problem, it can be tedious to document the key takeaways. With runbooks, this documentation happens automatically. Everything you need for a postmortem meeting is contained within a Dynamic Network Map, including all runbook data. During postmortem, you can just pull the map on the big screen and everyone in the meeting can see the problem area, the Executable Runbook(s) the engineers used, the data they gathered, and the notes they took–all in one convenient format.
Step 3: Painless Procedure Enhancement
If your postmortem meeting concludes that a procedure needs to change, you can edit it right on the spot. Simply open the source runbook file from the shared folder, make the necessary enhancements (e.g. add new steps to troubleshoot faster next time), then save it. Just that easily, all future use of the runbook, whether manual or API-triggered, will use the updated procedure.